
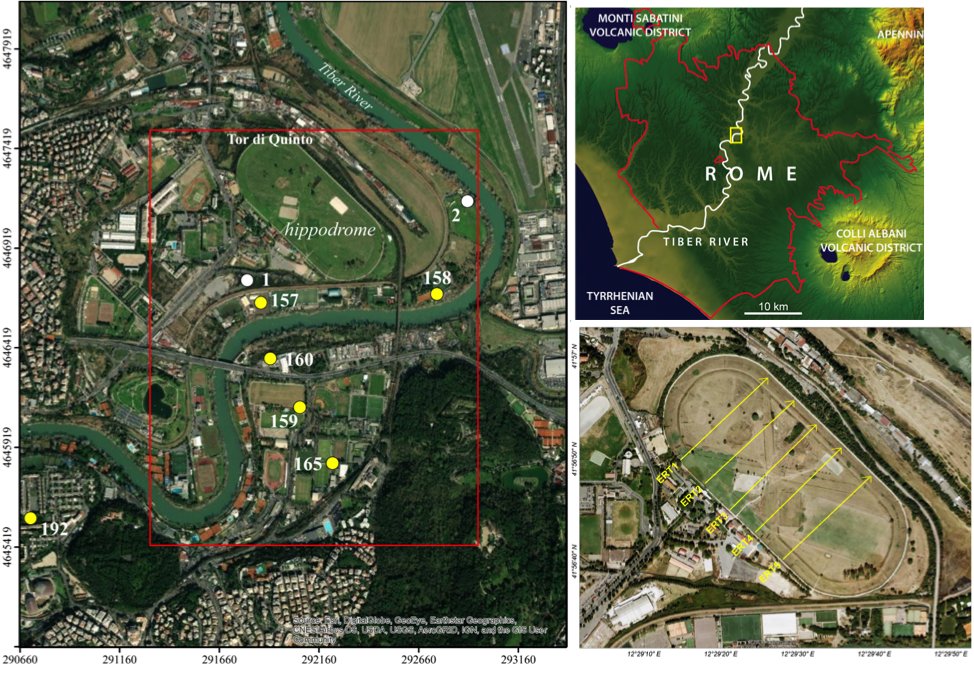
In the framework of the study of the soil CO2 emission in the urban area of Rome, data of the Tor di Quinto zone (yellow rectangle in upper-right figure) have been collected and processed. A 3 km2 wide area has been investigated with 551 measurements (red rectangle in left figure). To ascertain the gas origin the water geochemistry of some shallow wells (yellow dots) have been studied together with the in-soil concentration of CO2 and radon in two sites (white dots). To reconstruct the stratigraphy of underground deposits, results of five geoelectrical profiles in the Tor di Quinto hippodrome (low-right figure) have been analysed..