

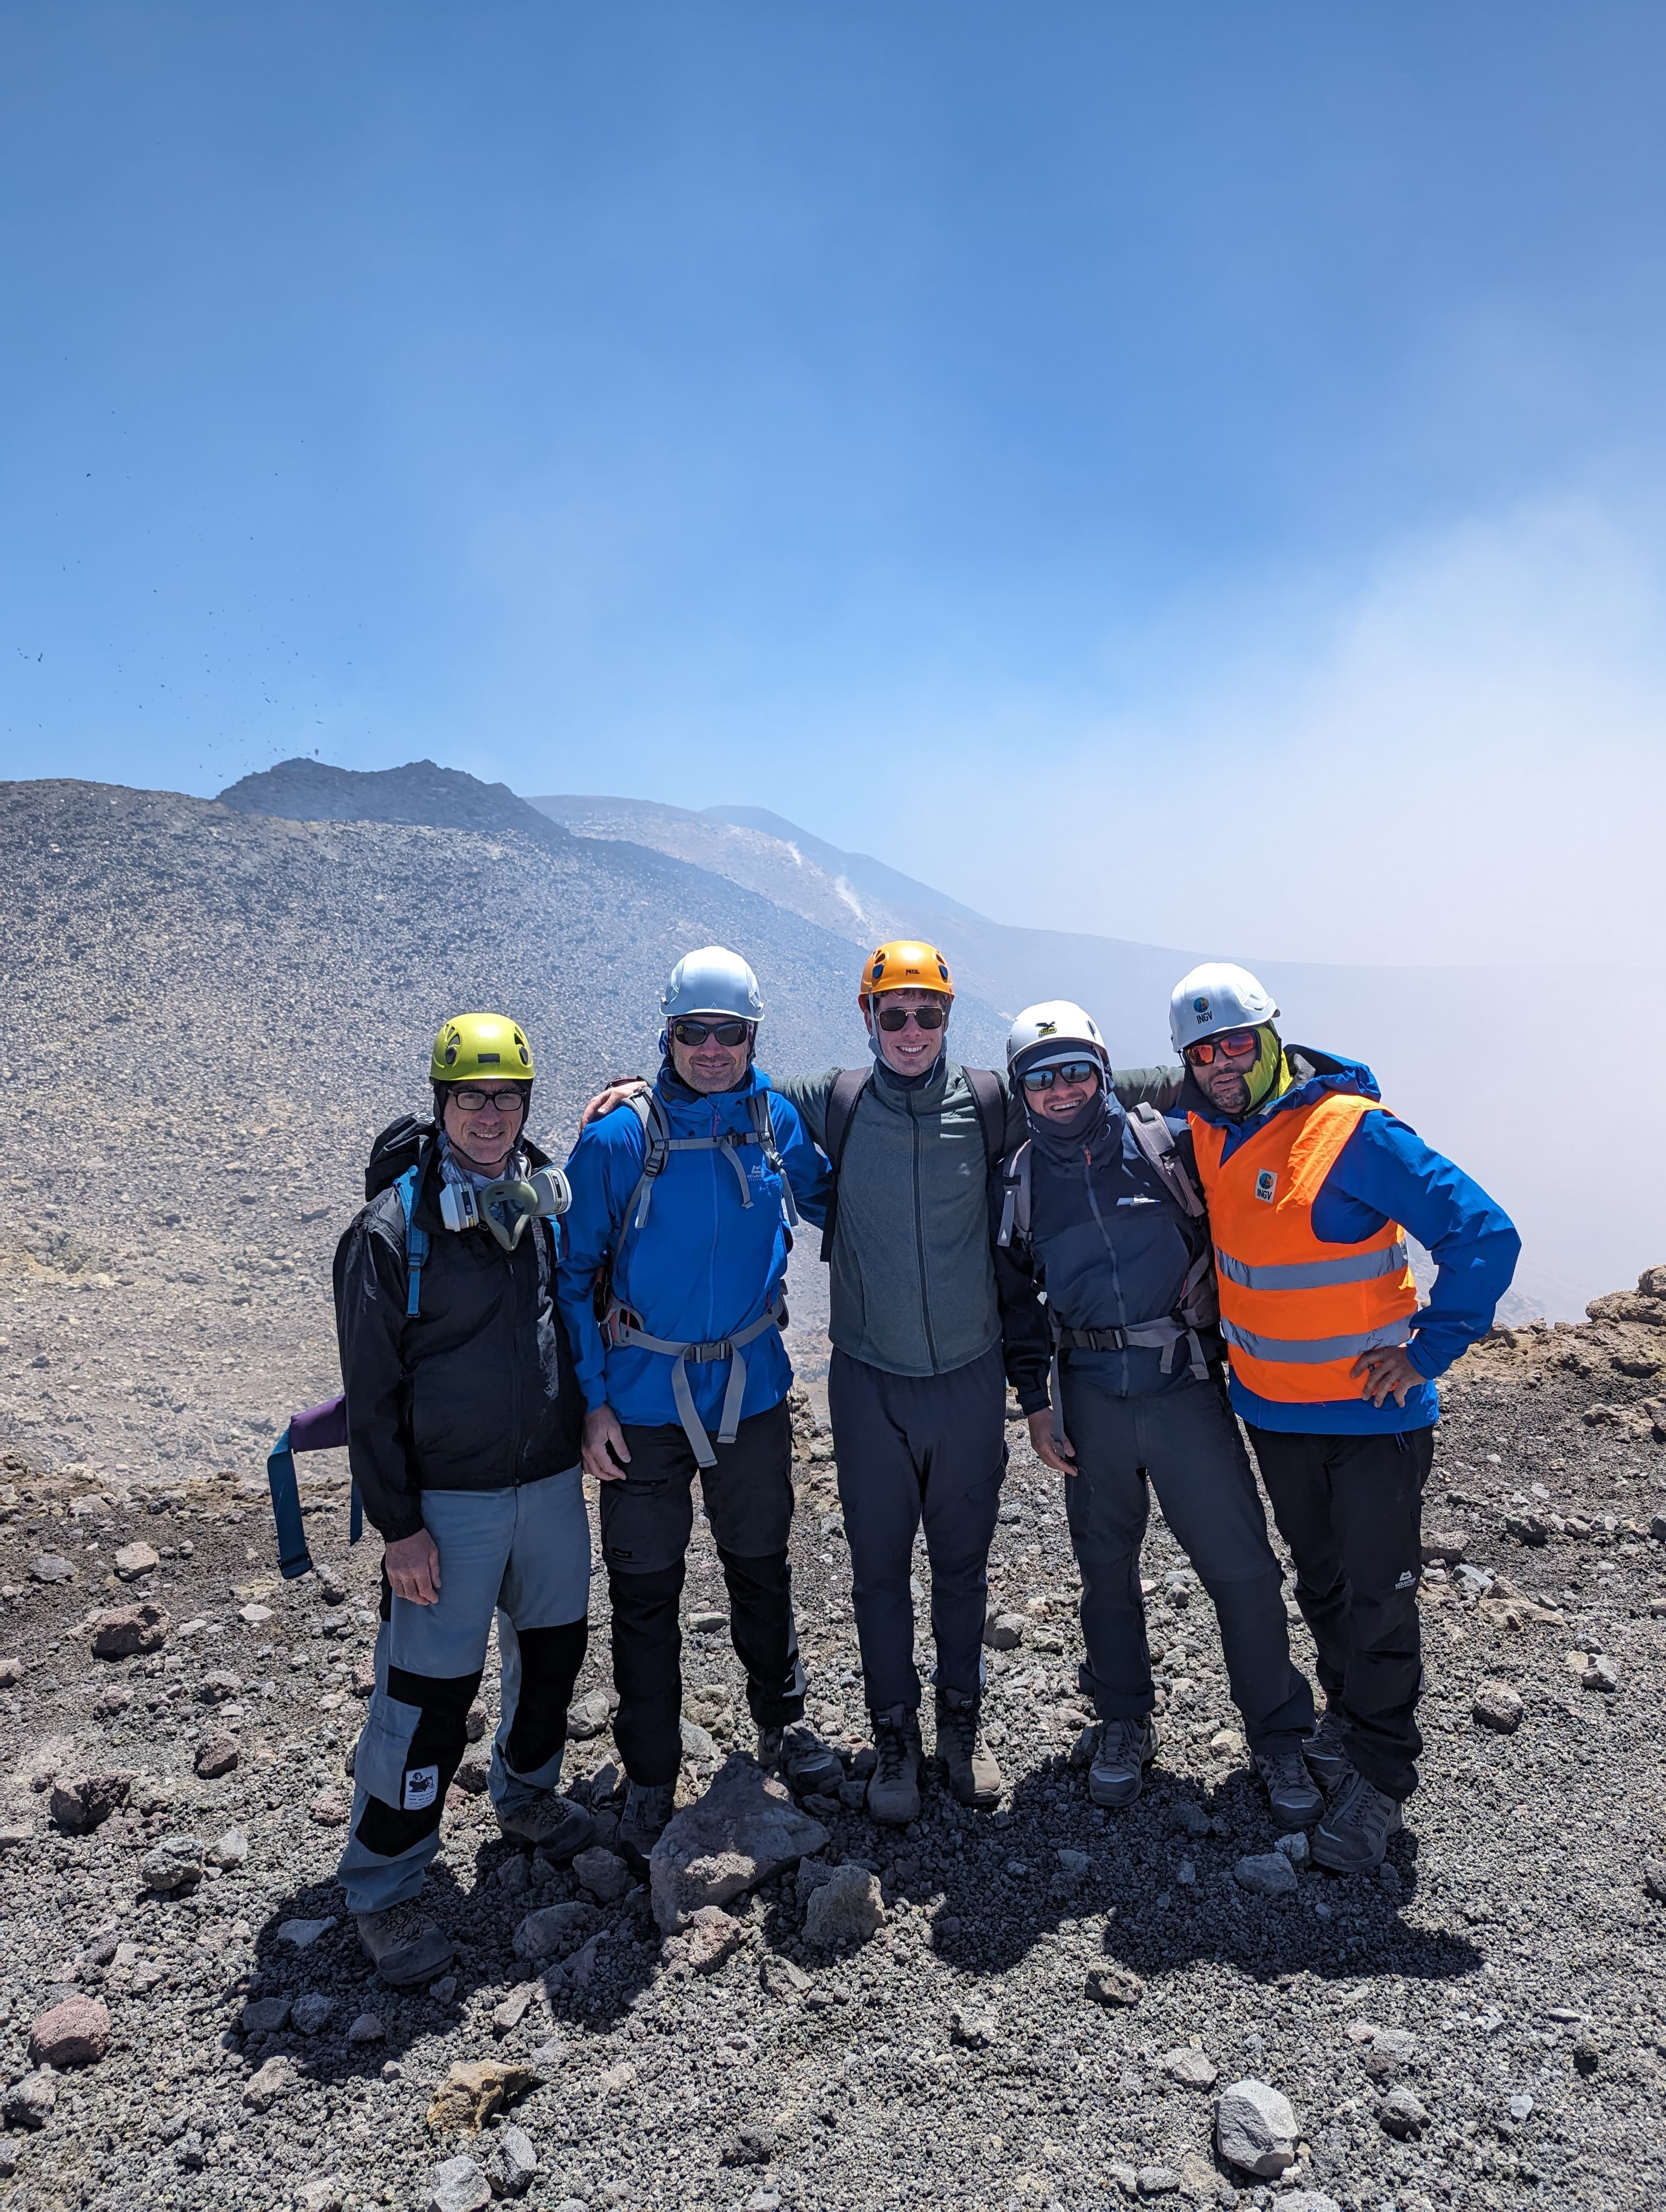
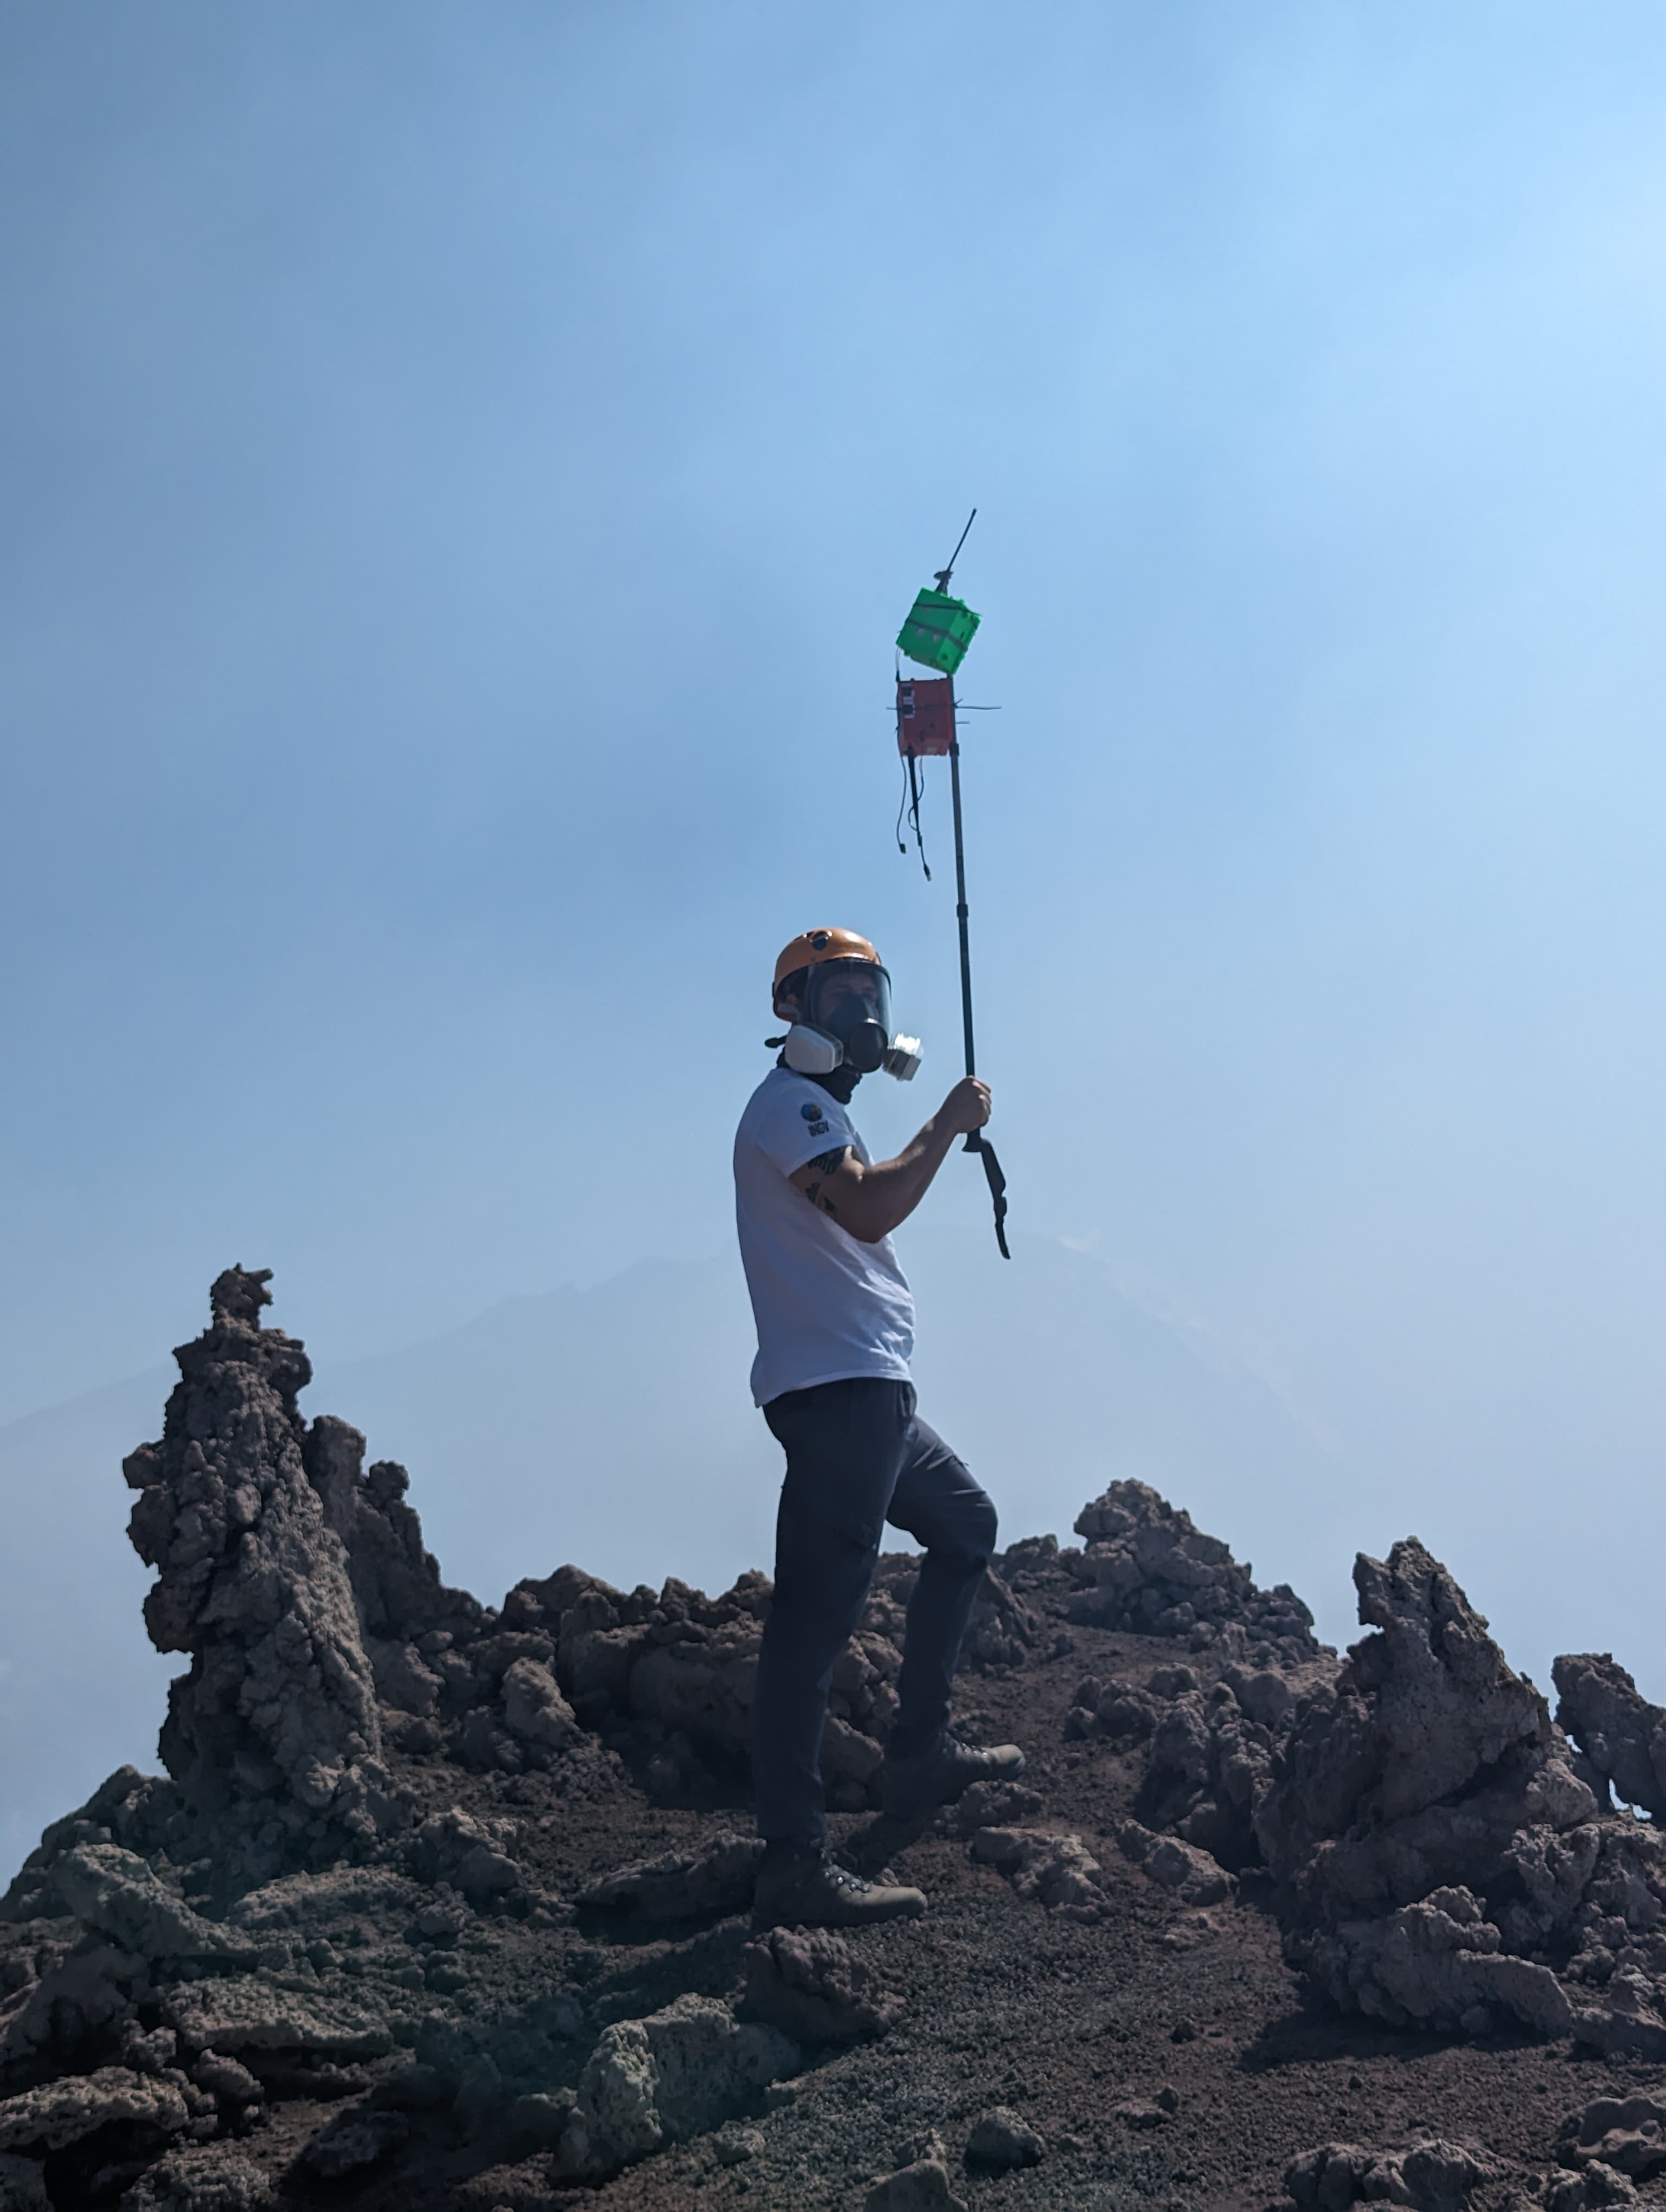
From 25 to 29 June 2024, researchers from INGV and University of Pisa (see Figure 1, left plate), realized a field campaign on Etna volcano to make a second test of the new volcanosondes developed by the Space Systems Laboratory of the University of Pisa in the sphere of the VOLANDO project.
The volcanosondes (see Figure 1, right plate), equipped with sensors of Temperature, Humidity, Pressure, CO2, SO2, HCl, and an Optical Particle Counter (OPC), were the same used for the test realized at Parco naturalistico geotermico delle Biancane (Pisa) the 17 to 18 June 2024.
 |
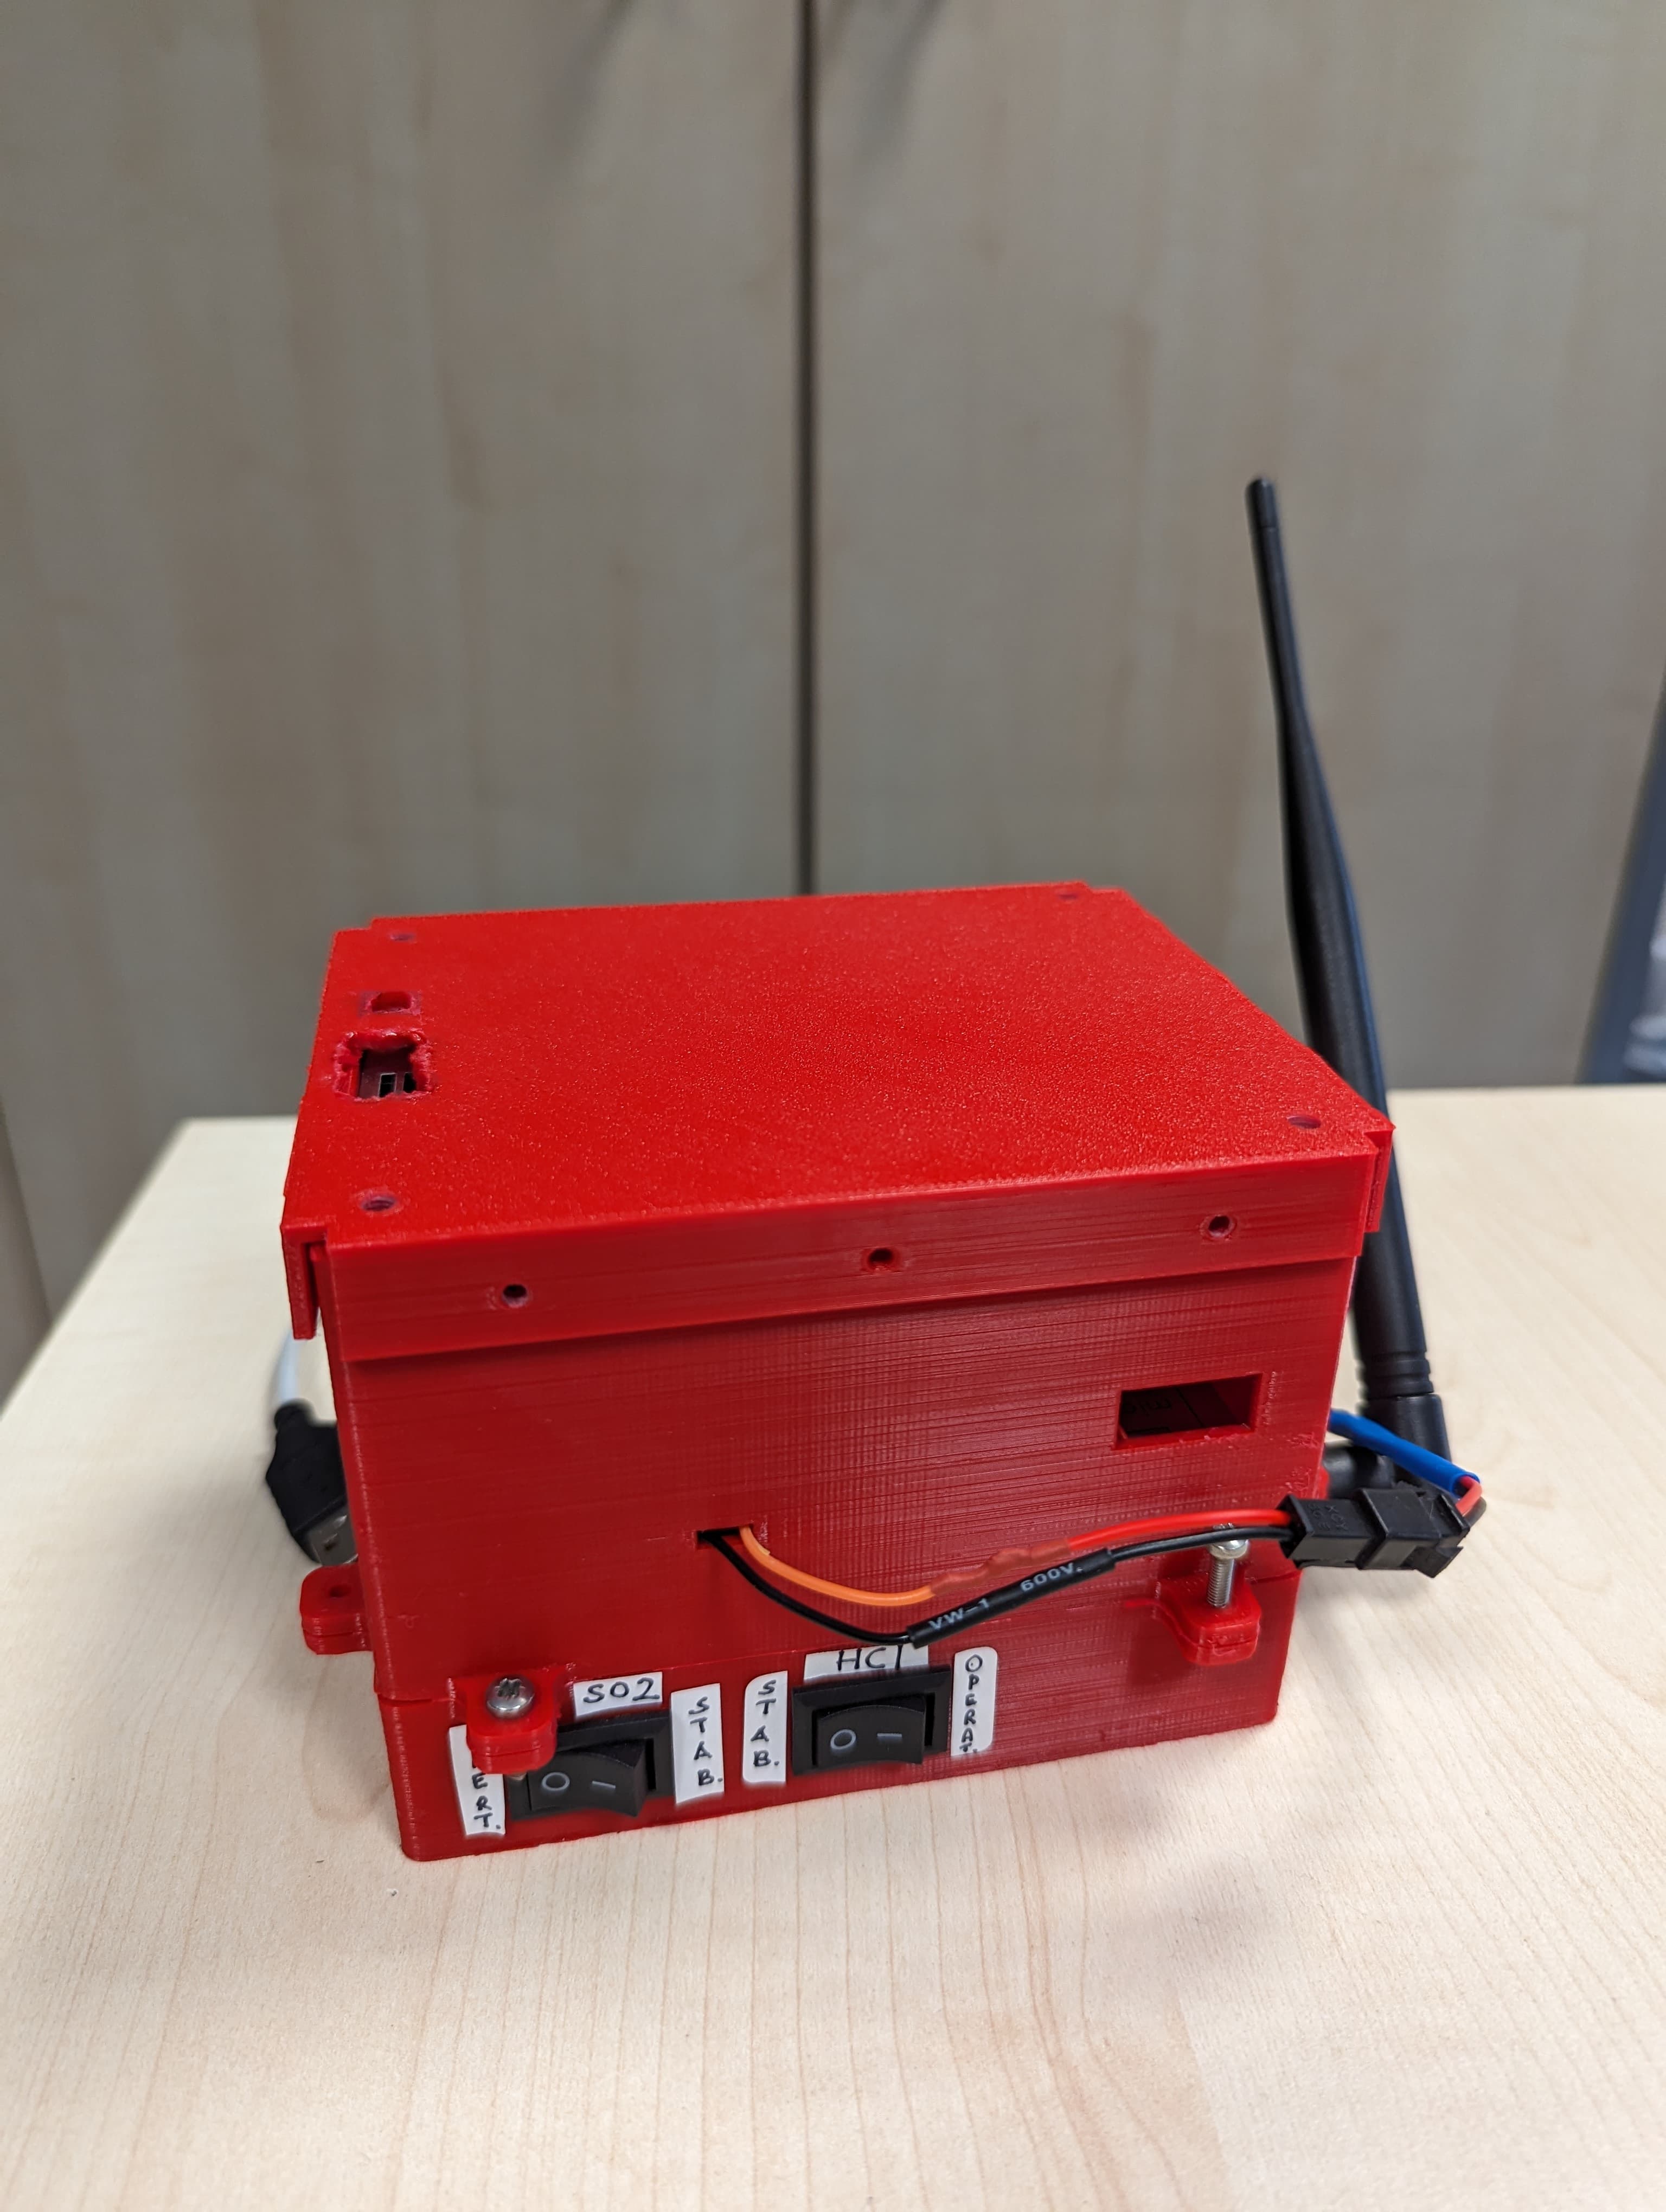 |
Figure 1. Left plate: INGV and University of Pisa researchers on Etna central craters. Right plate: one of the volcanosonde used for the tests.
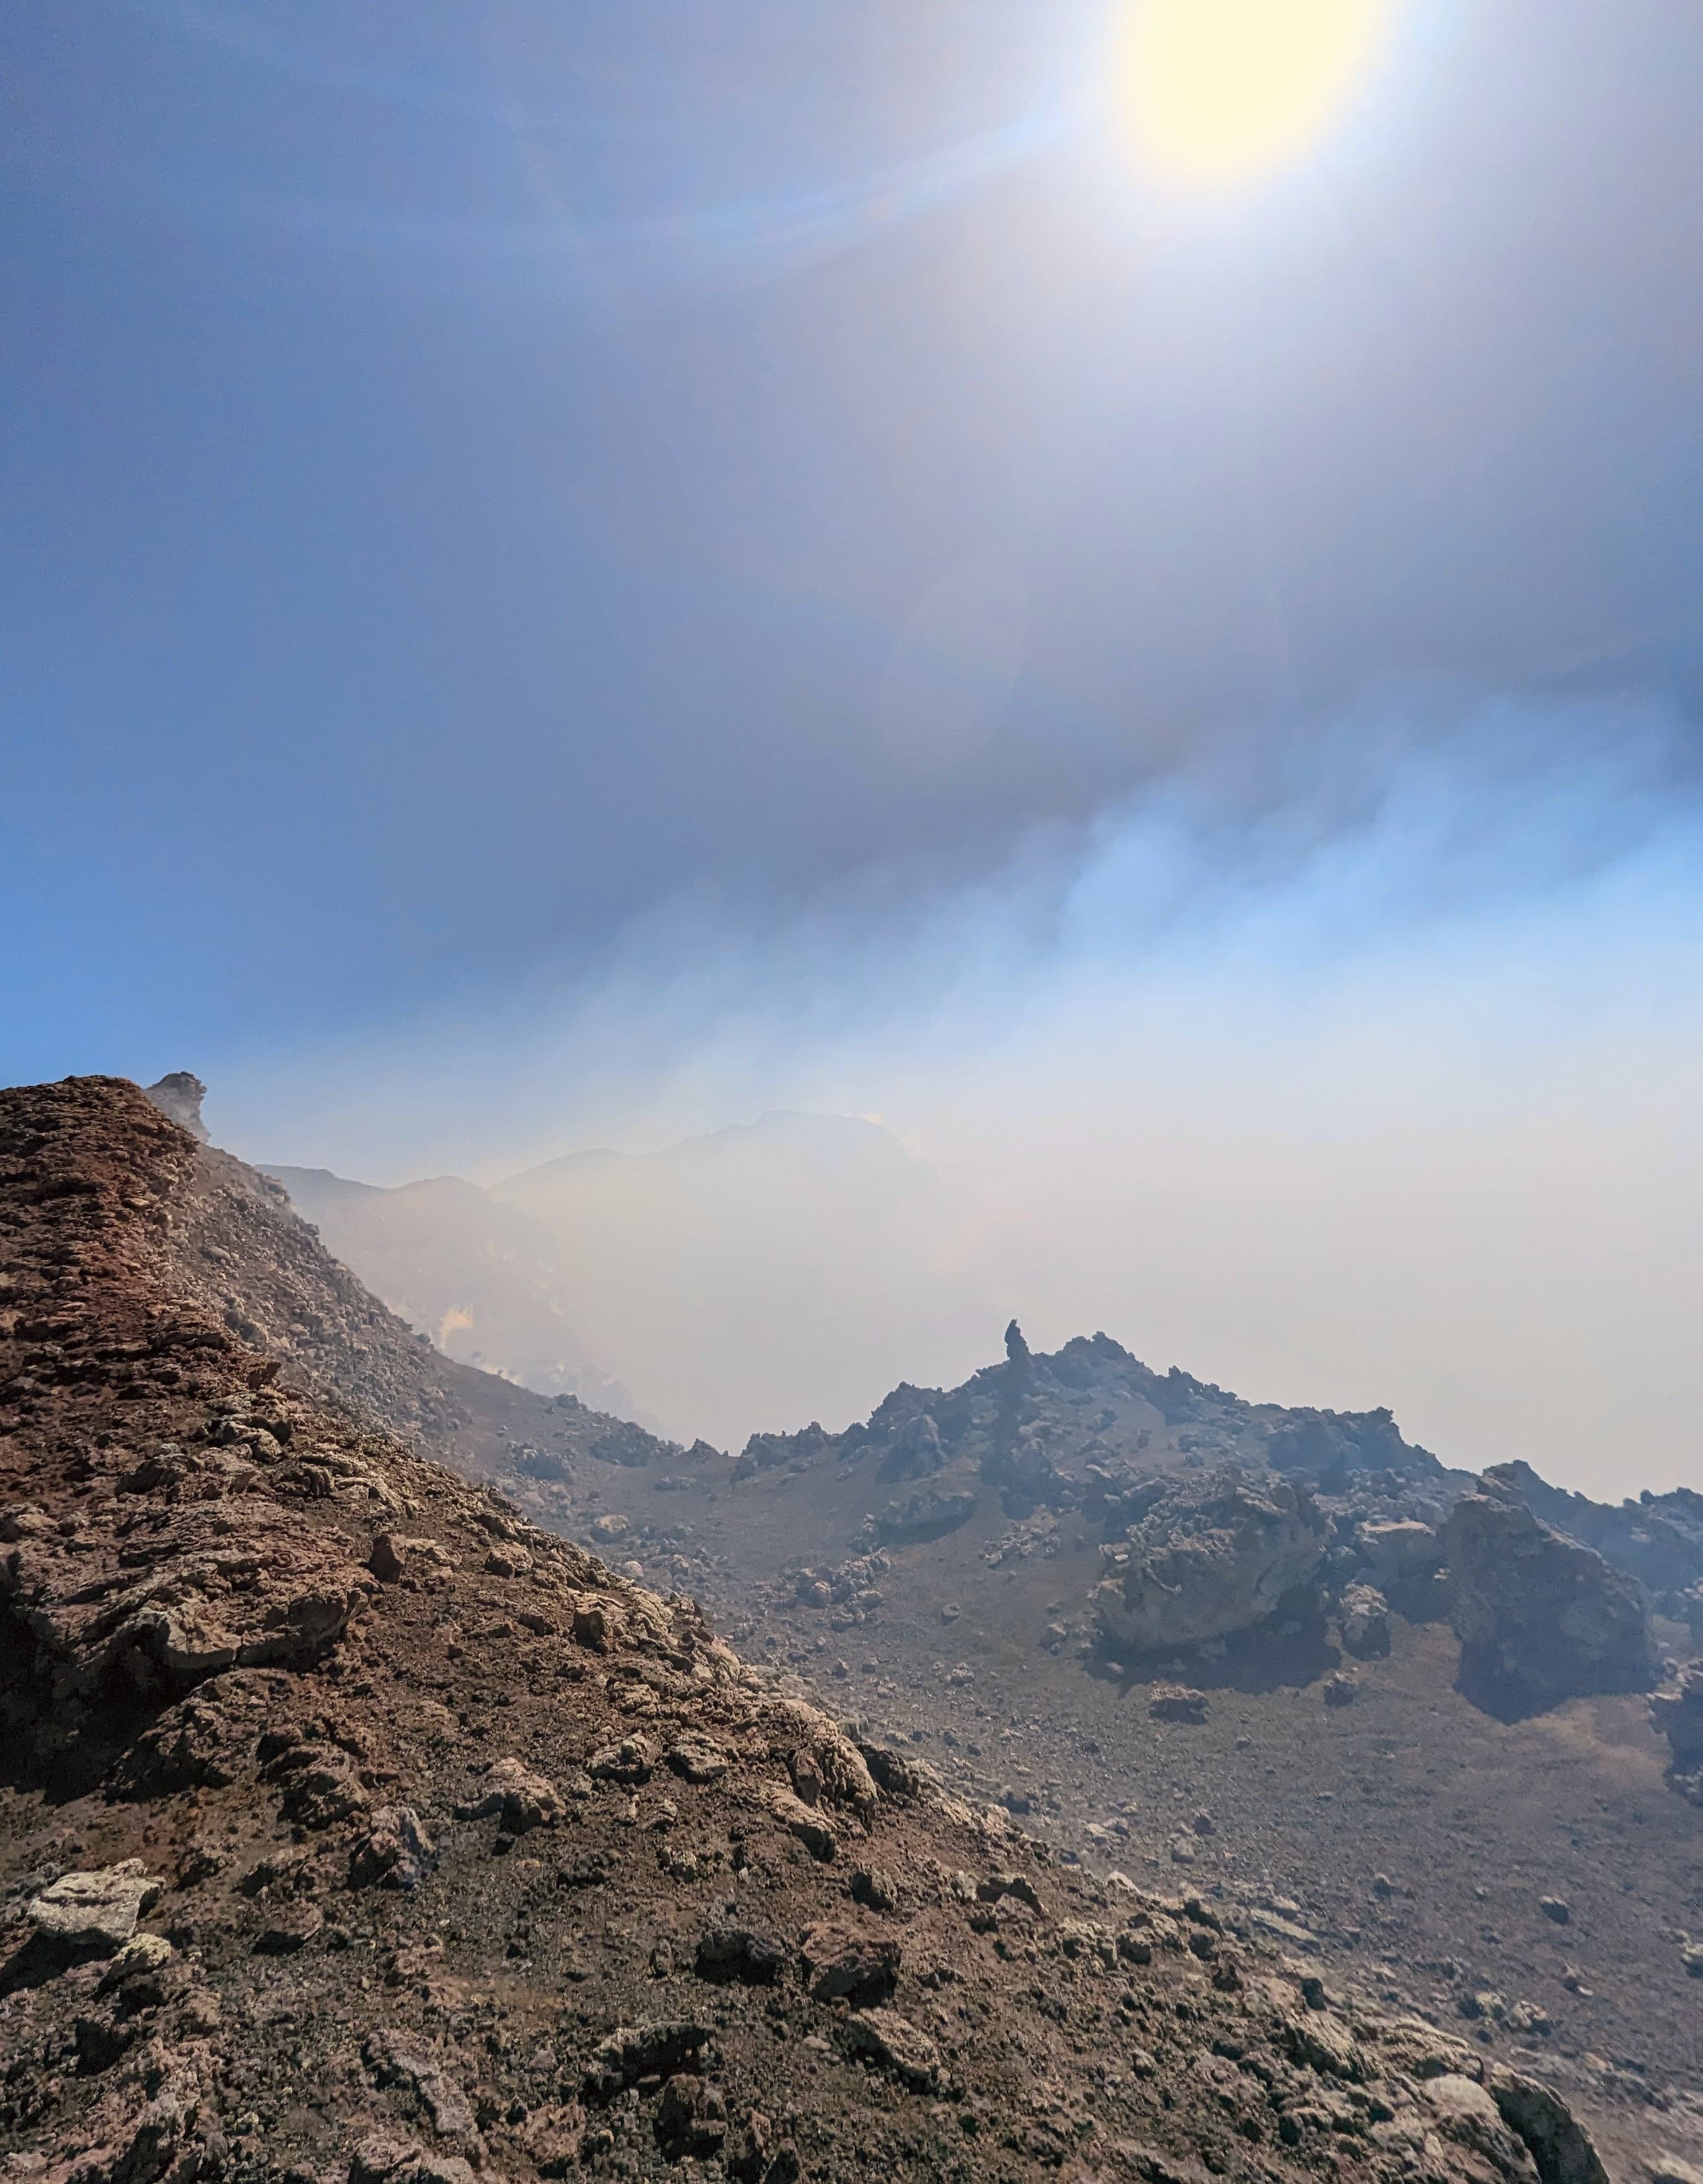
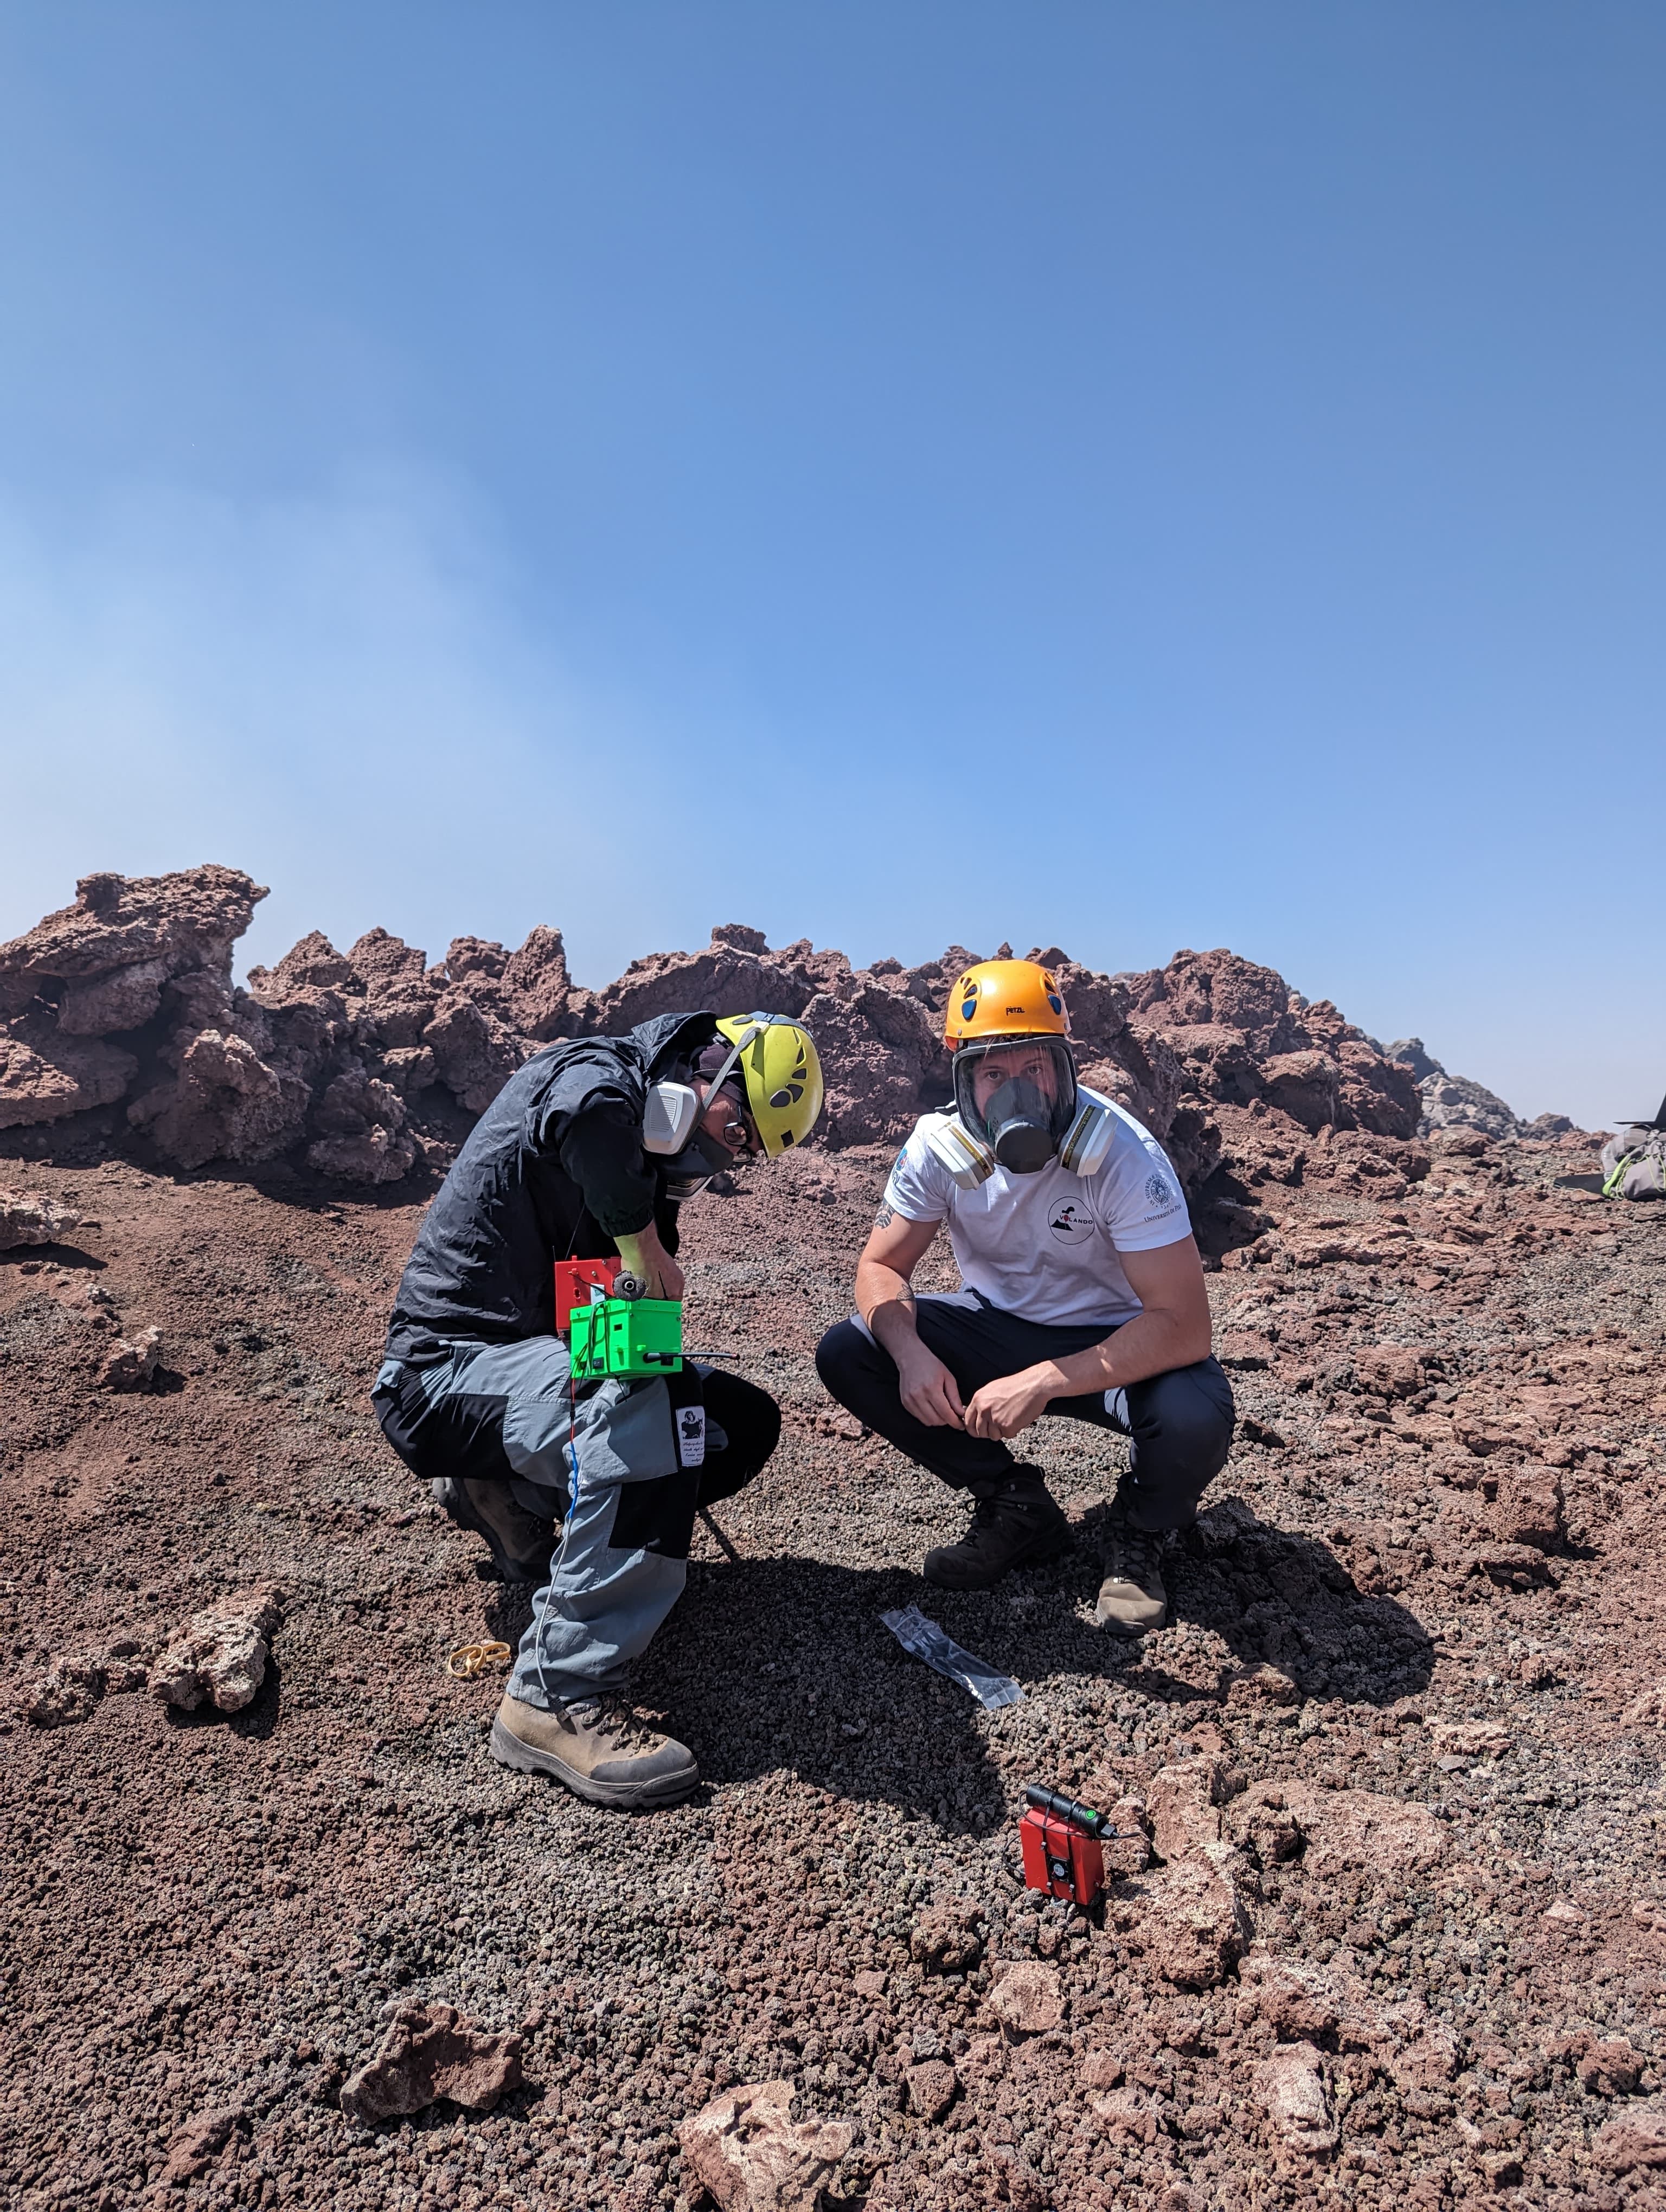
The measurements have been realized on the central craters of Etna (3350 m asl) in order to make a test in the same environment where the main field campaign of the first year of the project will be realized from 23 August to 1 September 2024. The 28th of June different continuous measurements were made to test the gas and particles sensors response to volcanic emission, the volcanosonde remote connection and the internal data storage. The data have been collected by using three volcanosondes, two with all gas sensors and a Sensirion OPC (named 3D and 7D) and the third with only an Alphasense OPC (named AS). Figure 2 shows a view of the central craters with strong volcanic emission in the foreground and the La Voragine crater in the behind (upper left), the volcanosonde preparation with the three volcanosondes (upper left), the first measurements test site (lower left) and the data acquisition in real time (lower right).
 |
 |
 |
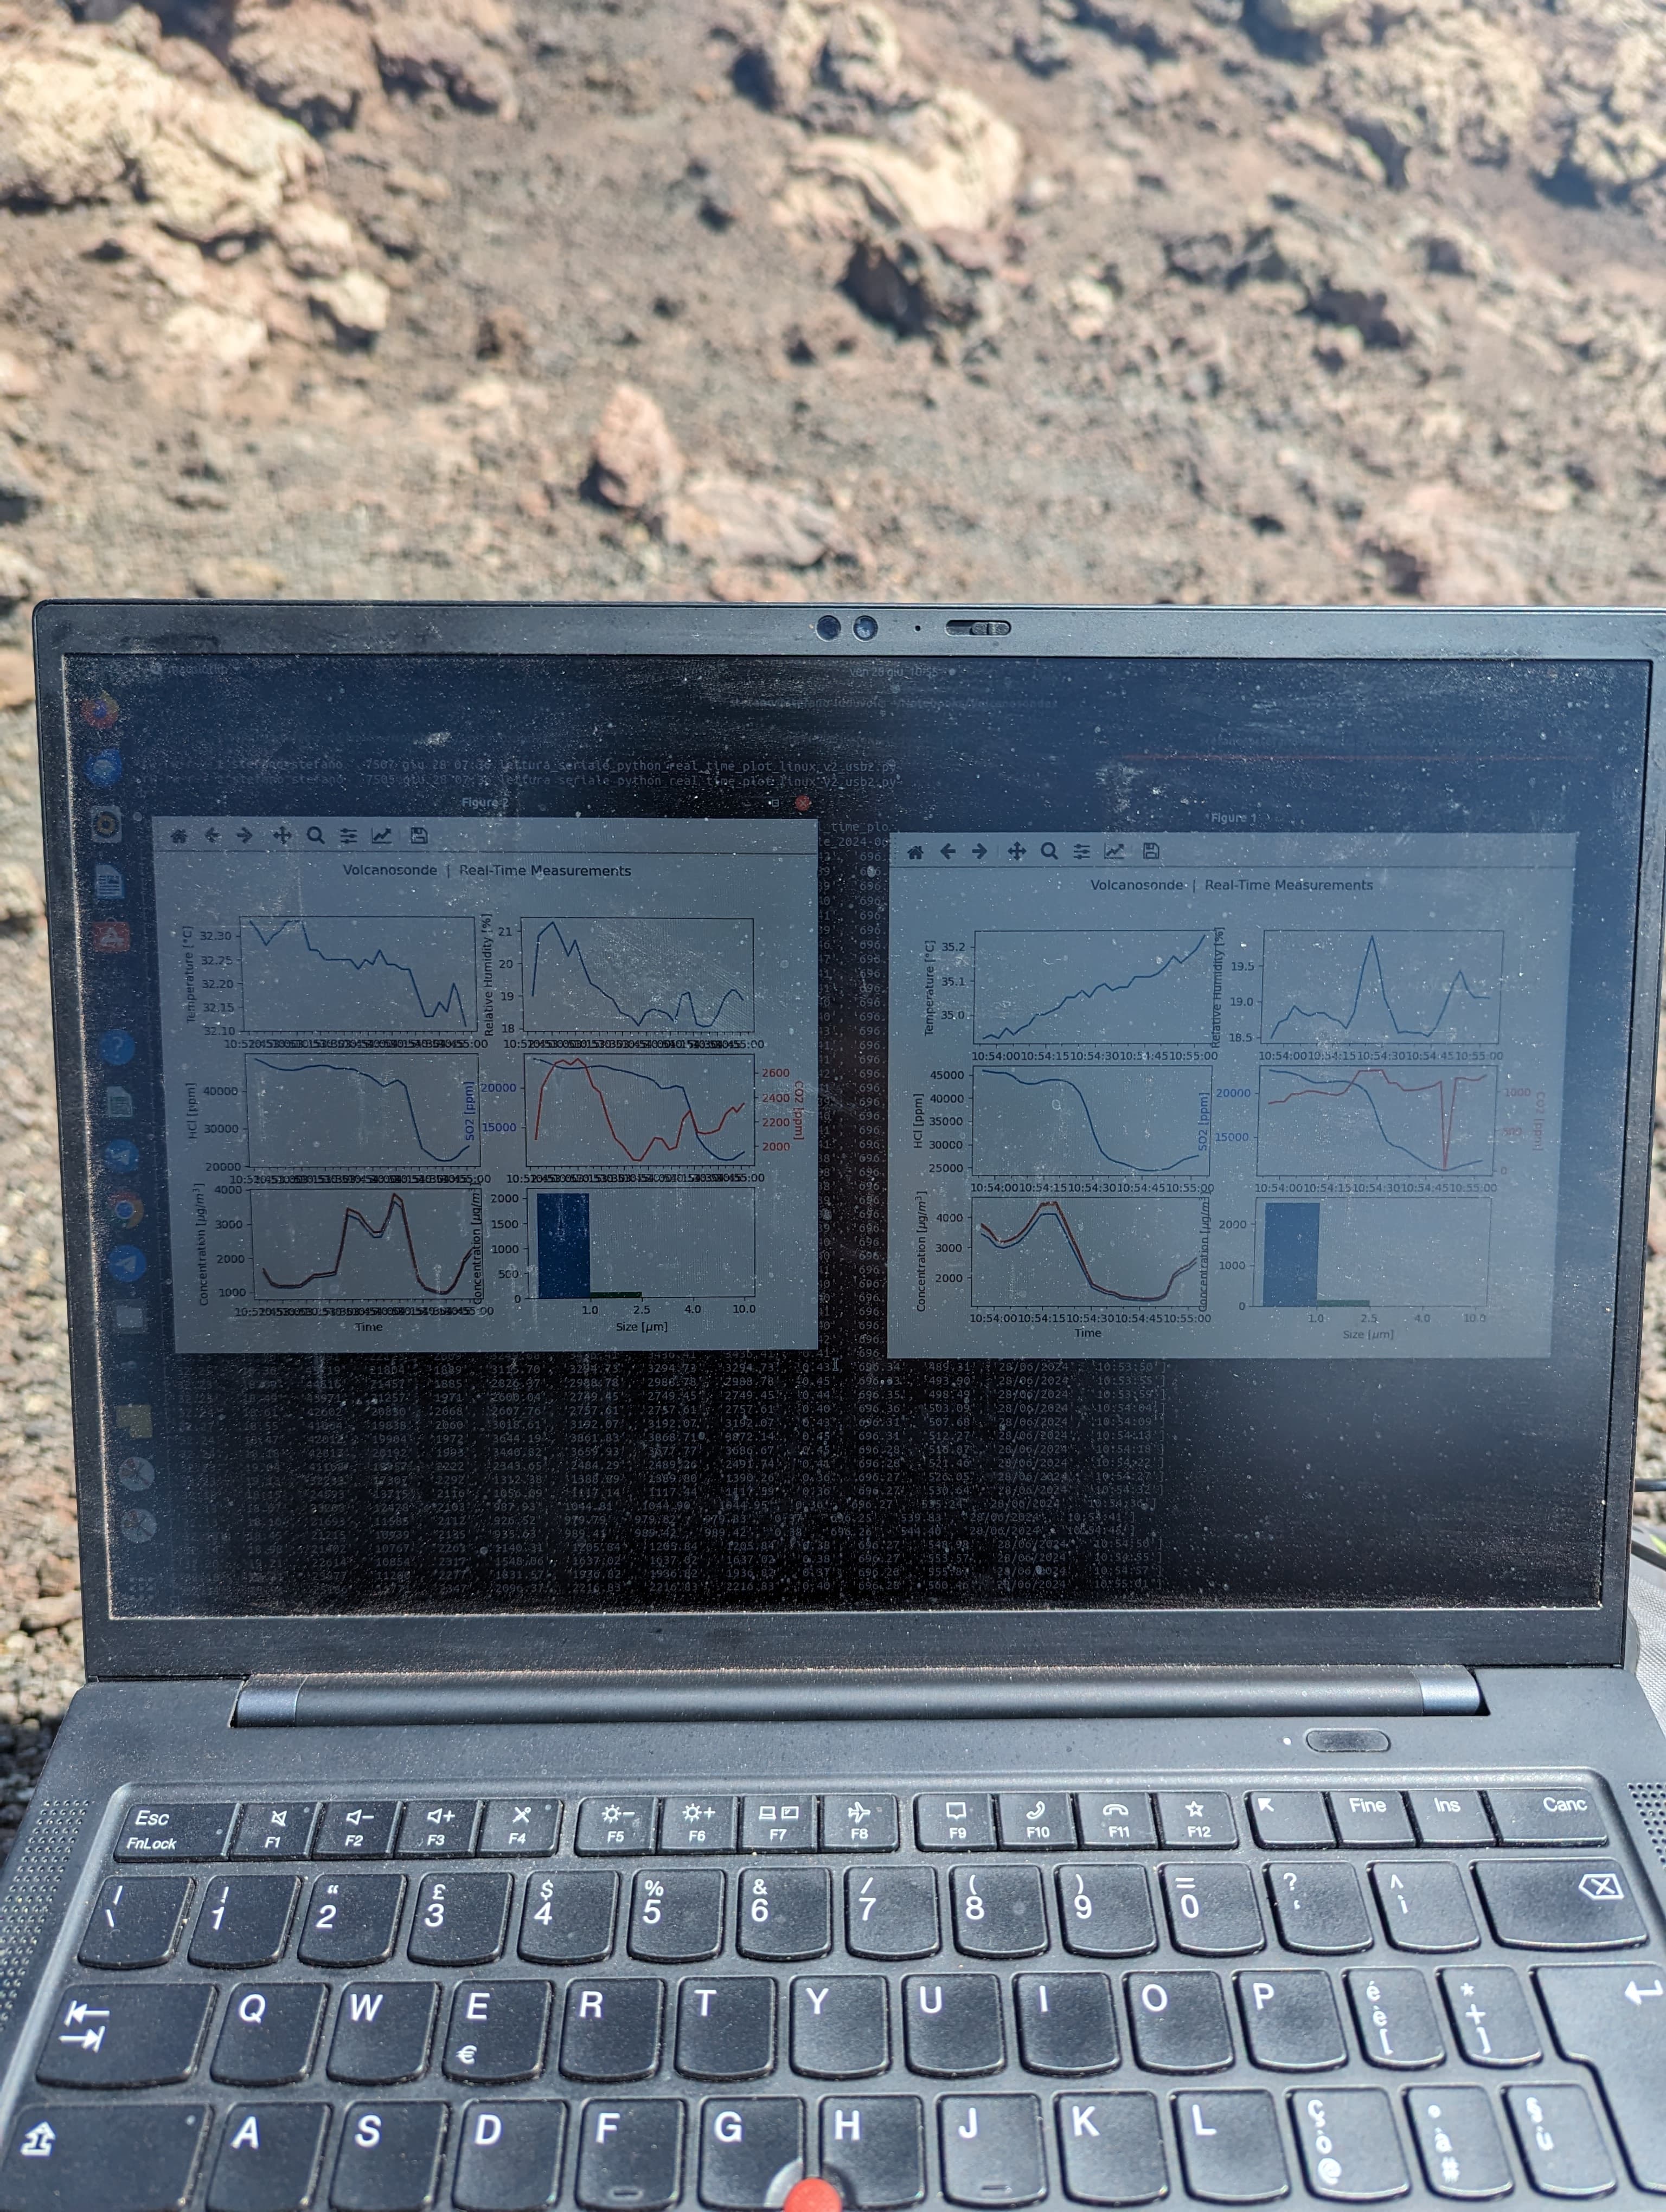 |
Figure 2. Upper left: view of the central craters. Upper right: Volcanosondes preparation with the three volcanosondes. Lower left: first measurements test site. Lower right: real time data acquisition.
Finally, the data have been post-processed. Figure 3 shows the CO2, SO2 and particle measurements collected during the test. As figure shows, the CO2 trends (upper left plot) are highly correlated but with a meaningful shift due to problems on a calibration of the 7D volcanosonde sensor, while the SO2 trends and values (upper right) result in good agreement. Due to problems with remote connection after about the 12:10 lt, the CO2 and SO2 3D signals become flat. Unfortunately it was not possible to recover this data as the internal data storage was not working. The lower plots of Figure 3 show the cross-comparison between the particles concentration of PM 1 and PM 2.5 measured using the OPC Sensirion sensors placed on 3D and 7D vulcanosondes and the concentration measured using the OPC Alphasense sensor placed on AC volcanosonde. The plots clearly shows a good agreement between the Sensirion OPC’s, while a general underestimation is found with the Alphasense OPC until about the 12:10 lt. After this time the cross-comparison result in better agreement. A possible reason of the Alphasense OPC measurements underestimation in the first measurement site (see Figure 2, lower left plate) is the different position between the 3D, 7D and AS volcanosondes. If 3D and 7D were placed on the stick, AS was placed on ground. After 12:20 lt, all the three volcanosondes were all placed on the ground of the second test site (closer to La Voragine crater).
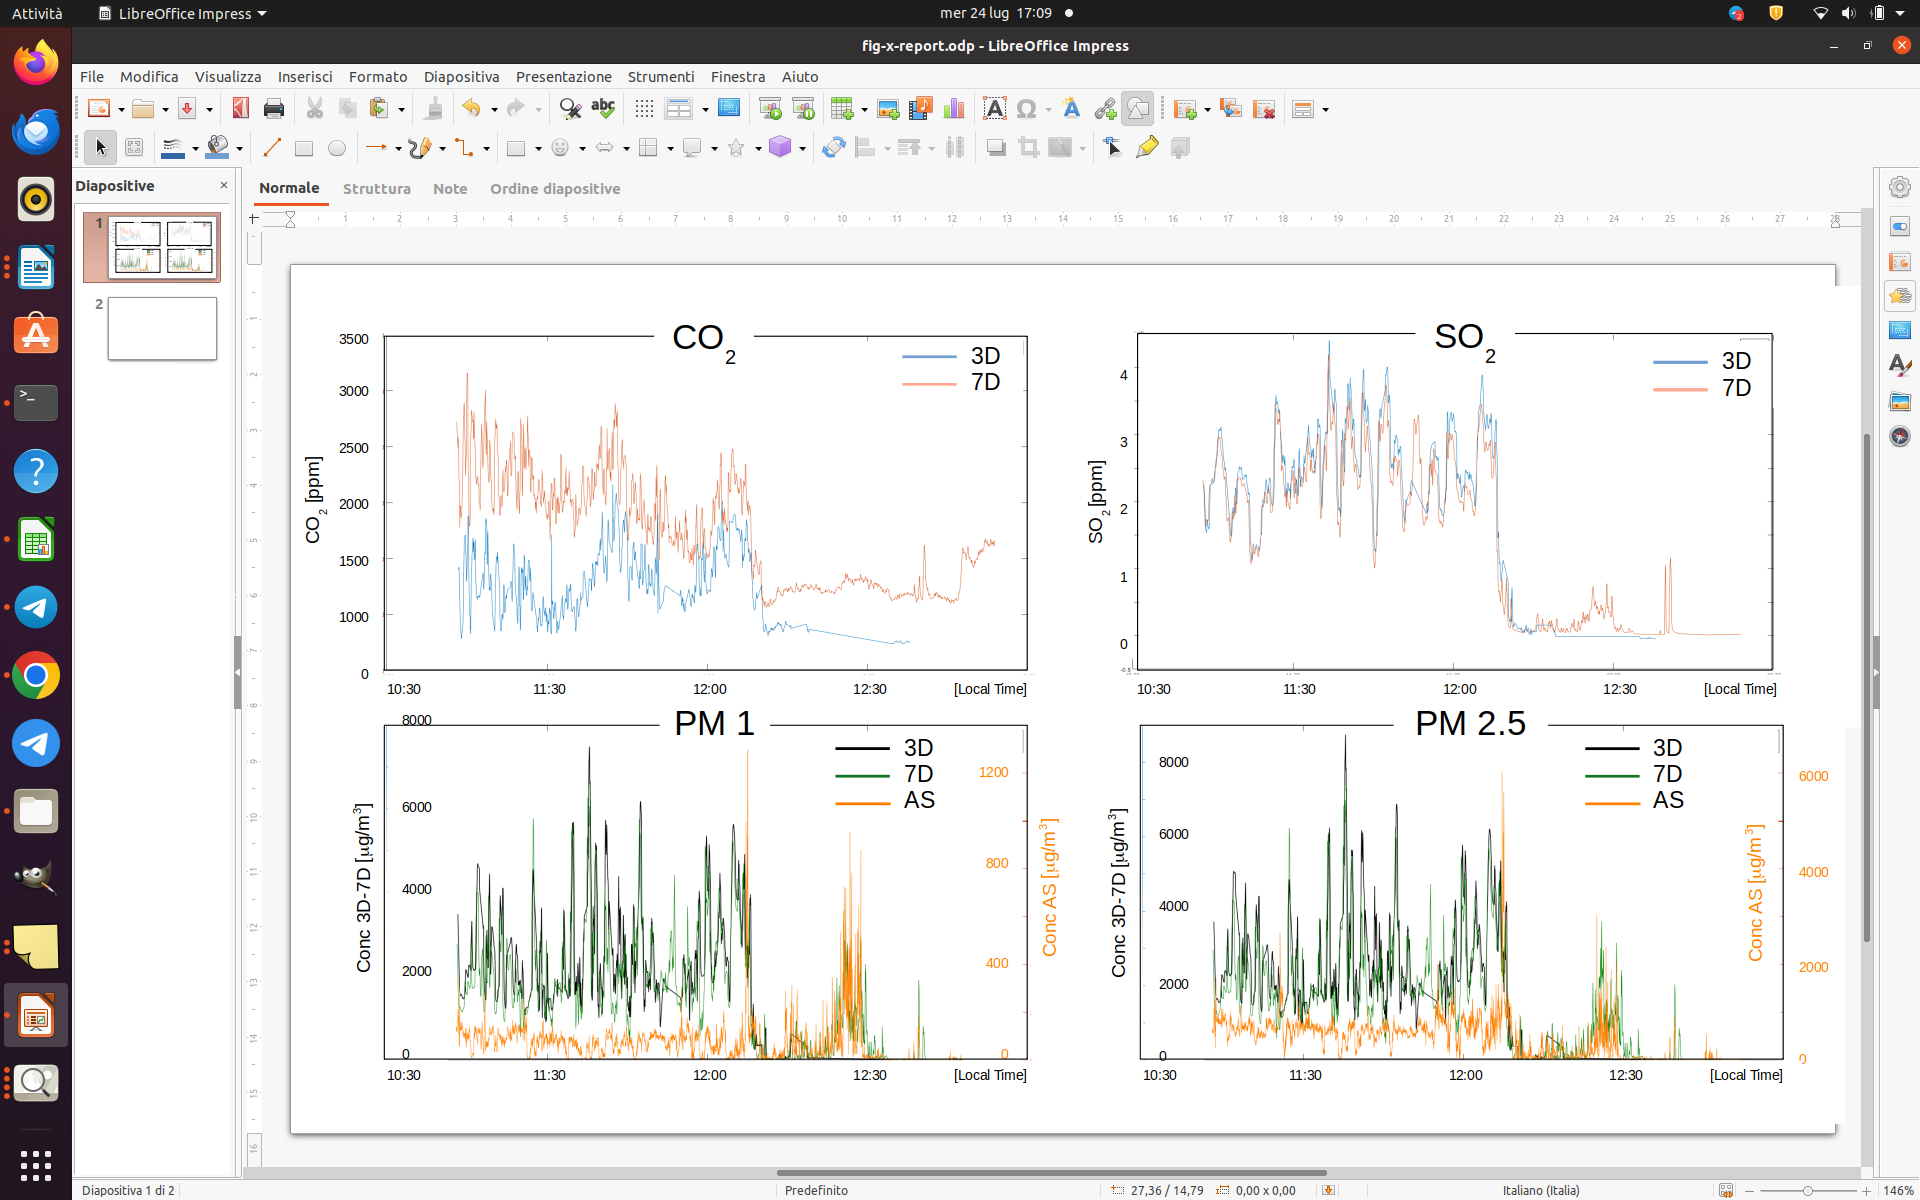
Figure 3. CO2, SO2, PM 1 and PM 2.5 cross comparisons derived from the data collected by the three volcanosondes (3D, 7D and AS) during the 28th measurements.
The results obtained from these tests indicate the need to properly calibrate the gas sensors as also to check the internal and remote communication.