

A field campaign has been organized from 8 to 10 April 2025 on Vulcano Island (Aeolian Islands, Italy) in order to cross-compare the gas measurements obtained by the volcanosondes, developed in the sphere of the VOLANDO project, and the measurements collected by different consolidated multi-gas systems. Colleagues from INGV-ONT, INGV-OE, University of Pisa, University of Palermo, and University of Costa Rica participated in the campaign (see Figure 1). Each team used their own instruments to conduct measurements of volcanic gases, including CO₂, SO₂, H2Sl and particles, at La Fossa crater. Table 1 summarizes all the instruments used during the field campaign.
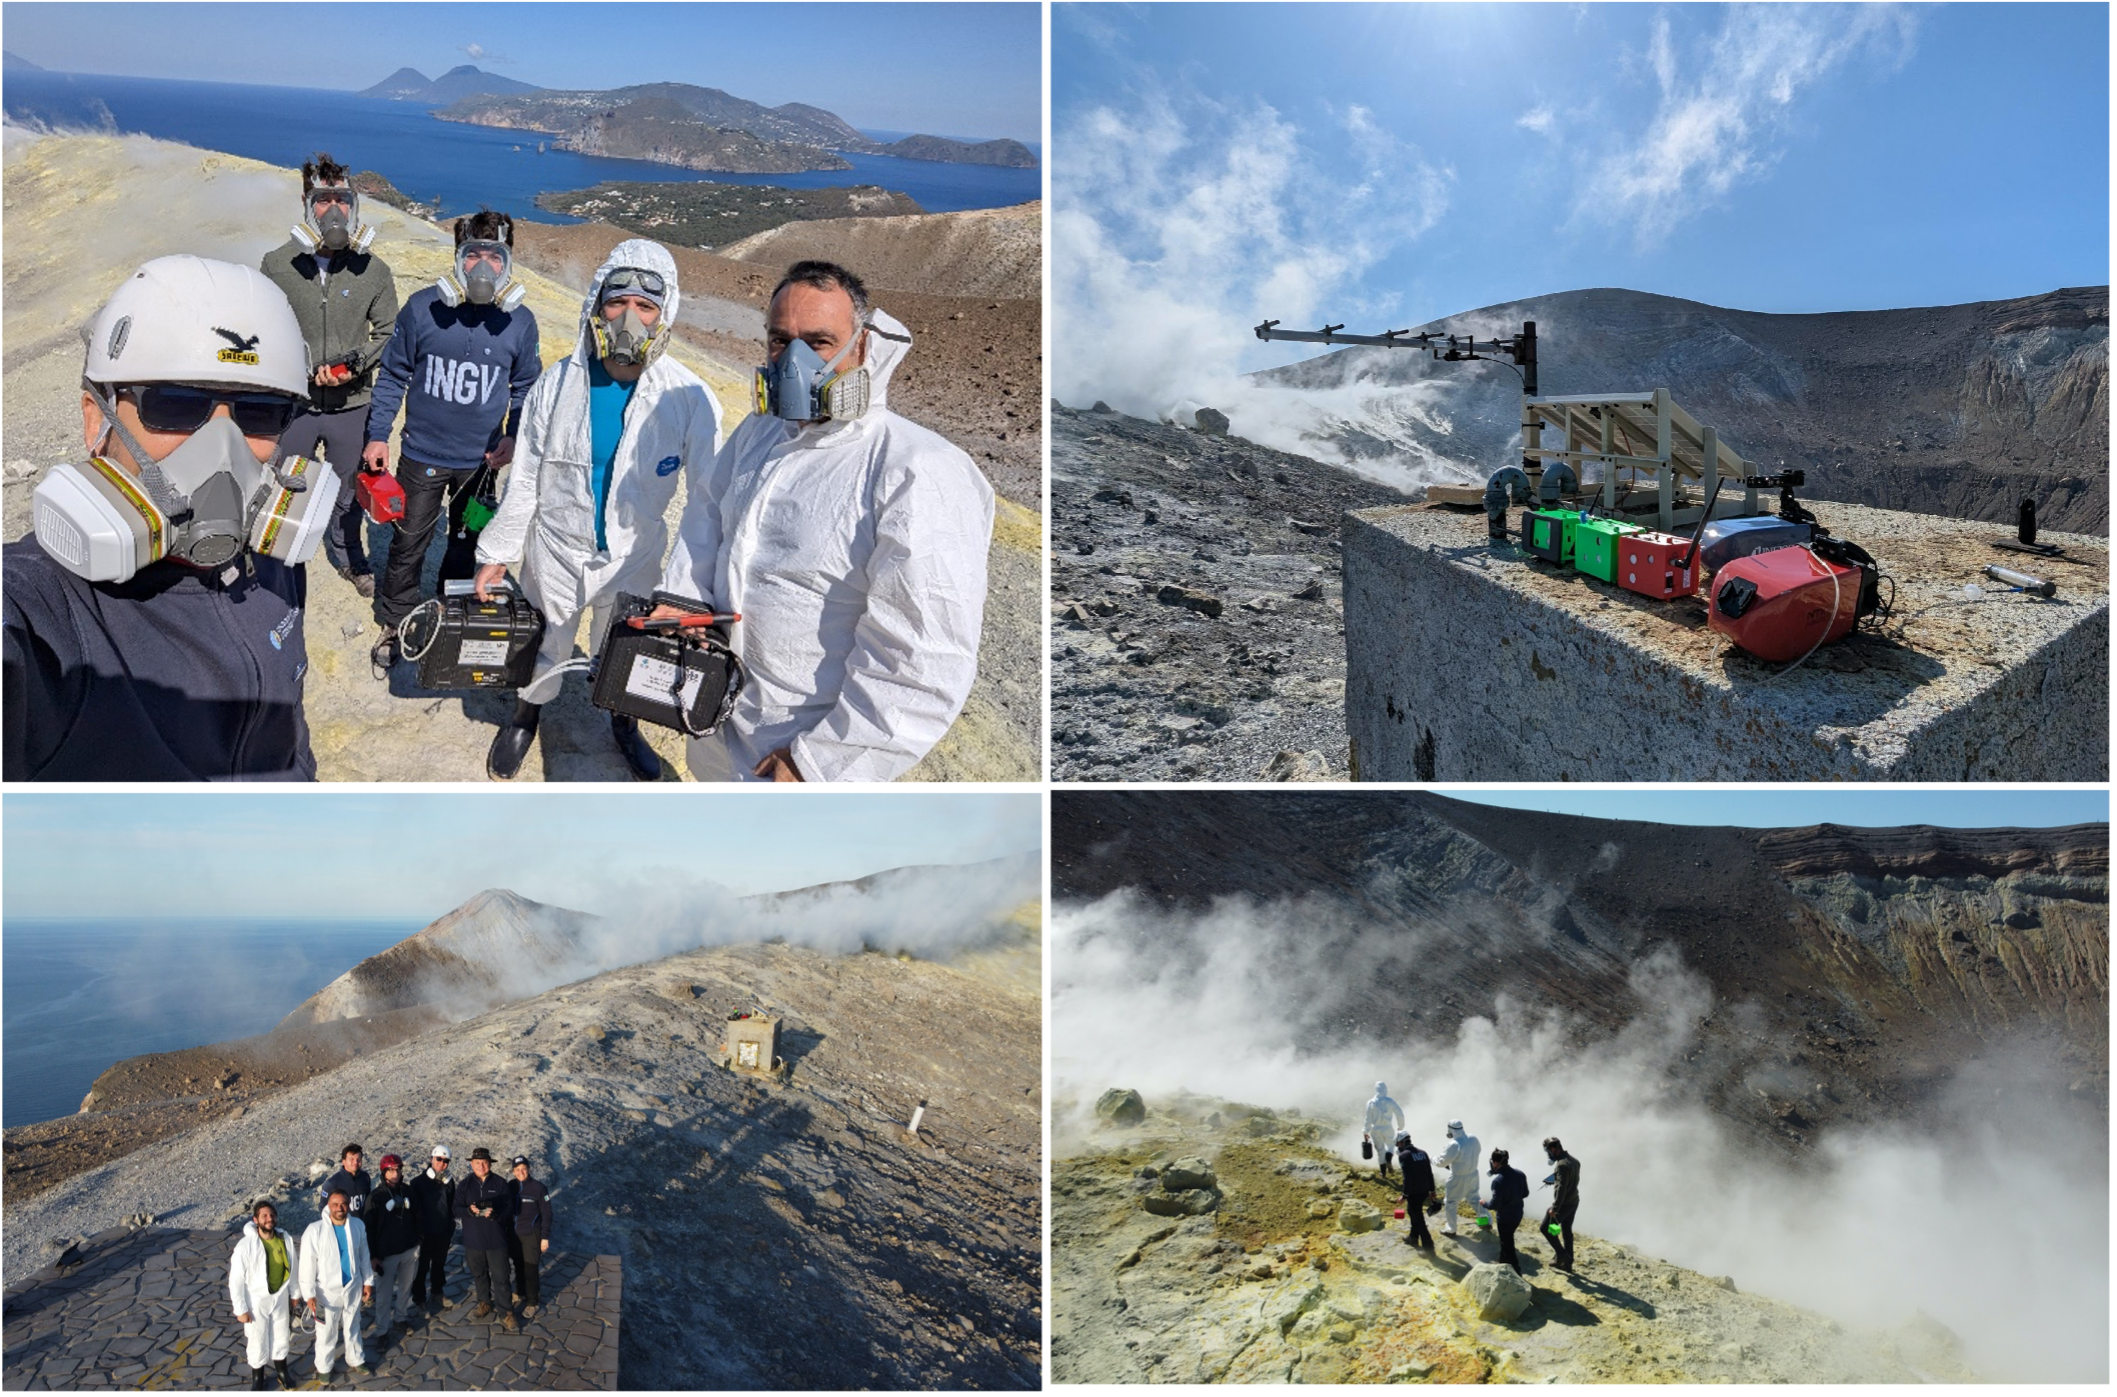 Figure 1. Some photos of colleagues from INGV-ONT, INGV-OE, University of Pisa, University of Palermo, and University of Costa Rica who participated in the field campaign are shown. The upper right plate shows three volcanosondes with two multi-gas instruments.
|
Instrument |
Developed by |
Reference |
|
Volcanosonde |
The Space Systems Laboratory of the University of Pisa in the sphere of the VOLANDO project |
Corradini et al.,2024 |
|
MiniGAS |
Dr. Jorge Andres Diaz from GasLab of the University of Costa Rica |
Silvestri et al., 2023 |
|
Multi-component Gas Analyzer Systems (MultiGAS & MultiGAS-PP2) |
The University of Palermo |
Aiuppa et al., 2005 |
Table 1. The instruments present during the field campaign
In this document, at first the measurements obtained by the volcanosondes are displayed considering the different days of measurements, then the cross comparison with the measurements collected by other instruments is discussed.
- Volcanosonde measurements
Table 2 summarizes the characteristics of the sensors in the volcanosonde used in the different days of measurements.
|
Date |
Volcanosonde |
Sensors |
Notes |
|
8 April 2025 |
7D |
SO2, CO2, HCl Temp, Humidity |
SO2 not calibrated CO2 not calibrated HCl not calibrated |
|
9 April 2025 |
7D |
SO2, CO2, H2S Temp, Humidity |
SO2 calibrated (7) CO2 not calibrated H2S calibrated (6) |
|
10 April 2025 |
3D |
SO2, CO2, HCl Temp, Humidity |
SO2 calibrated (6) CO2 calibrated HCl not calibrated |
|
7D |
SO2, CO2, HCl Temp, Humidity |
SO2 not calibrated CO2 calibrated HCl not calibrated |
Table 2. Characteristics of the sensors in the volcanosondes used during the field campaign. The number of brackets near the term “calibrated” indicates the calibration file.
- 08 April 2025
The volcanosonde measurements from 08 April 2025 are shown in Figure 2. On this day, SO₂ and CO₂ were not calibrated.
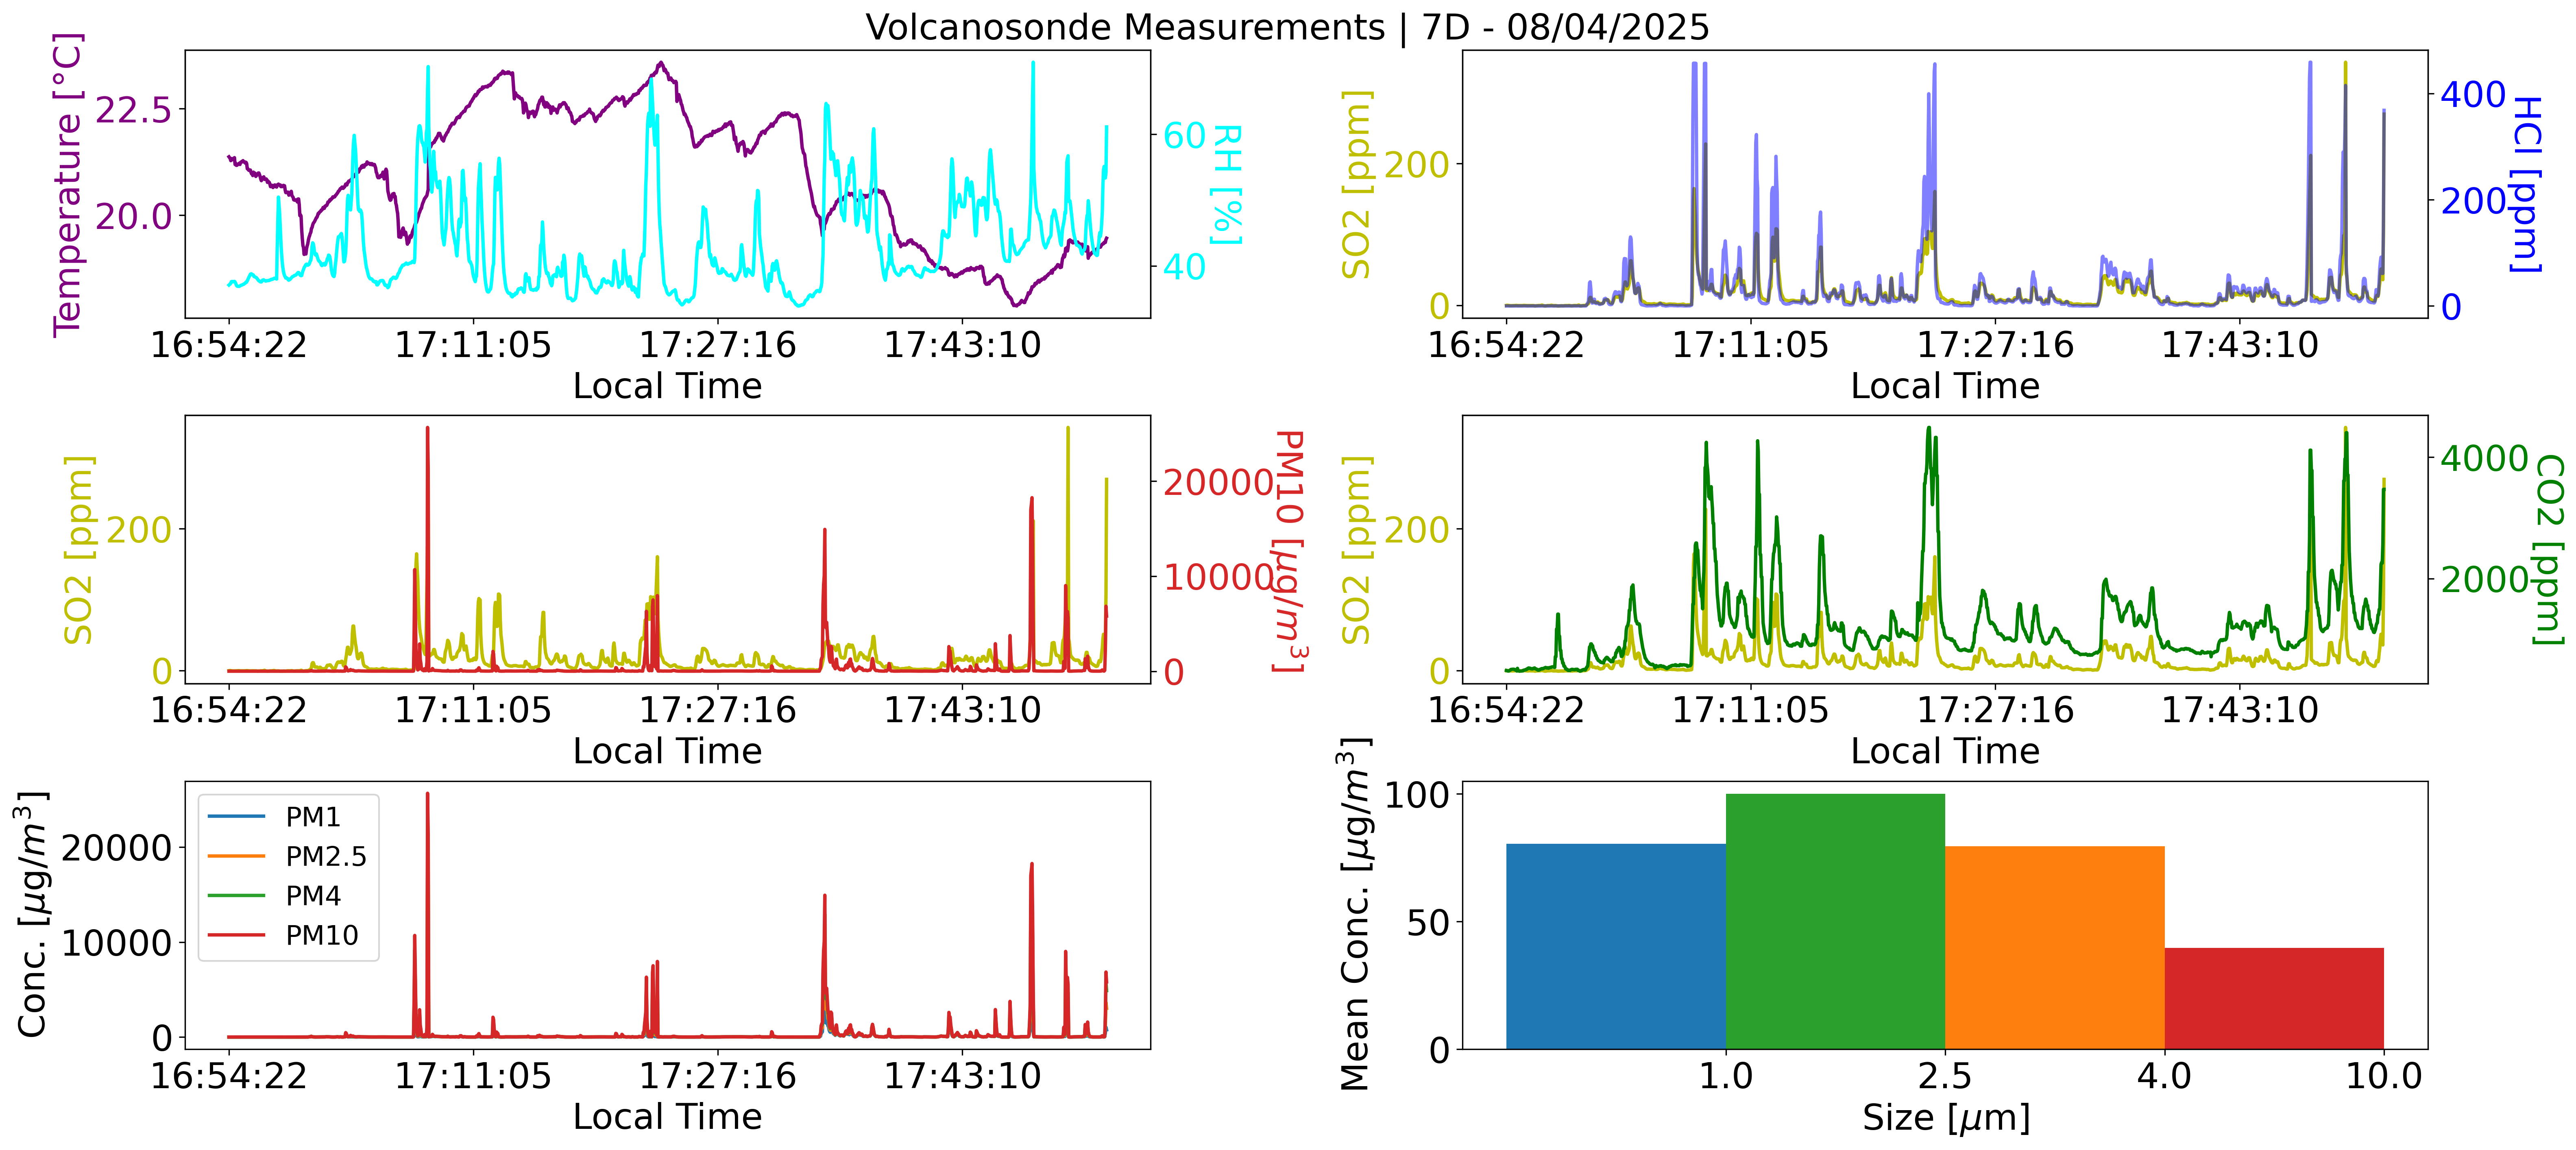 Figure 2. Volcanosonde measurements from 8 April 2025.
Figure 2 shows a very good correlation between SO2 and CO2 (middle right plot), as also with HCl and SO2 (top right plot). This latter indicates the influence of SO2 on HCl signal. The trend of the PM10 concentration shows a small correlation with SO2 (middle left plot) and also with relative humidity (see top left plot), indicating the presence of sulphur and water vapour droplets in the volcanic fumaroles. Finally, the size distribution appears a log-normal with a maximum around 1 and 2.5 ìm (lower right plot).
- 09 April 2025
The volcanosonde measurements from 09 April 2025 are shown in Figure 3. Even if the correlation between the SO2 and CO2 measurements is meaningful (middle right plot), the SO2 values appear with maximum values extremely high. The SO₂ and H2S sensors recorded the identical values, suggesting a possible short circuit or electronic failure.
 Figure 3. Volcanosonde measurements from 9 April 2025 (7D).
- 10 April 2025
The volcanosonde measurements from 10 April 2025 are shown in Figure 4 and 5, for the 7D and 3D instruments, respectively.
For the 7D instrument, the SO₂ sensor shows too low values. Despite this, there is a good correlation between the SO₂ and CO₂ measurements. Additionally, the HCl sensor experienced a failure.
For the 3D instrument, the SO₂ and CO₂ sensors were calibrated. As shown in Figure 5, the measurements are of good quality, and there is a strong correlation between the SO₂ and CO₂ data. In this instrument, the HCl sensor experienced a failure.
Considering the 10 April SO₂ and CO₂ measurements, an analysis was conducted using the RatioCalc 3.2 software (Tamburello, 2015). Notably, the two signals show a strong correlation. Figure 6 shows the CO₂ and SO₂ measurements aligned using the point of maximum correlation. Figure 7 presents the correlation plot, where the coefficient of correlation is R² = 0,70 and the CO₂/SO₂ ratio is 13,2.
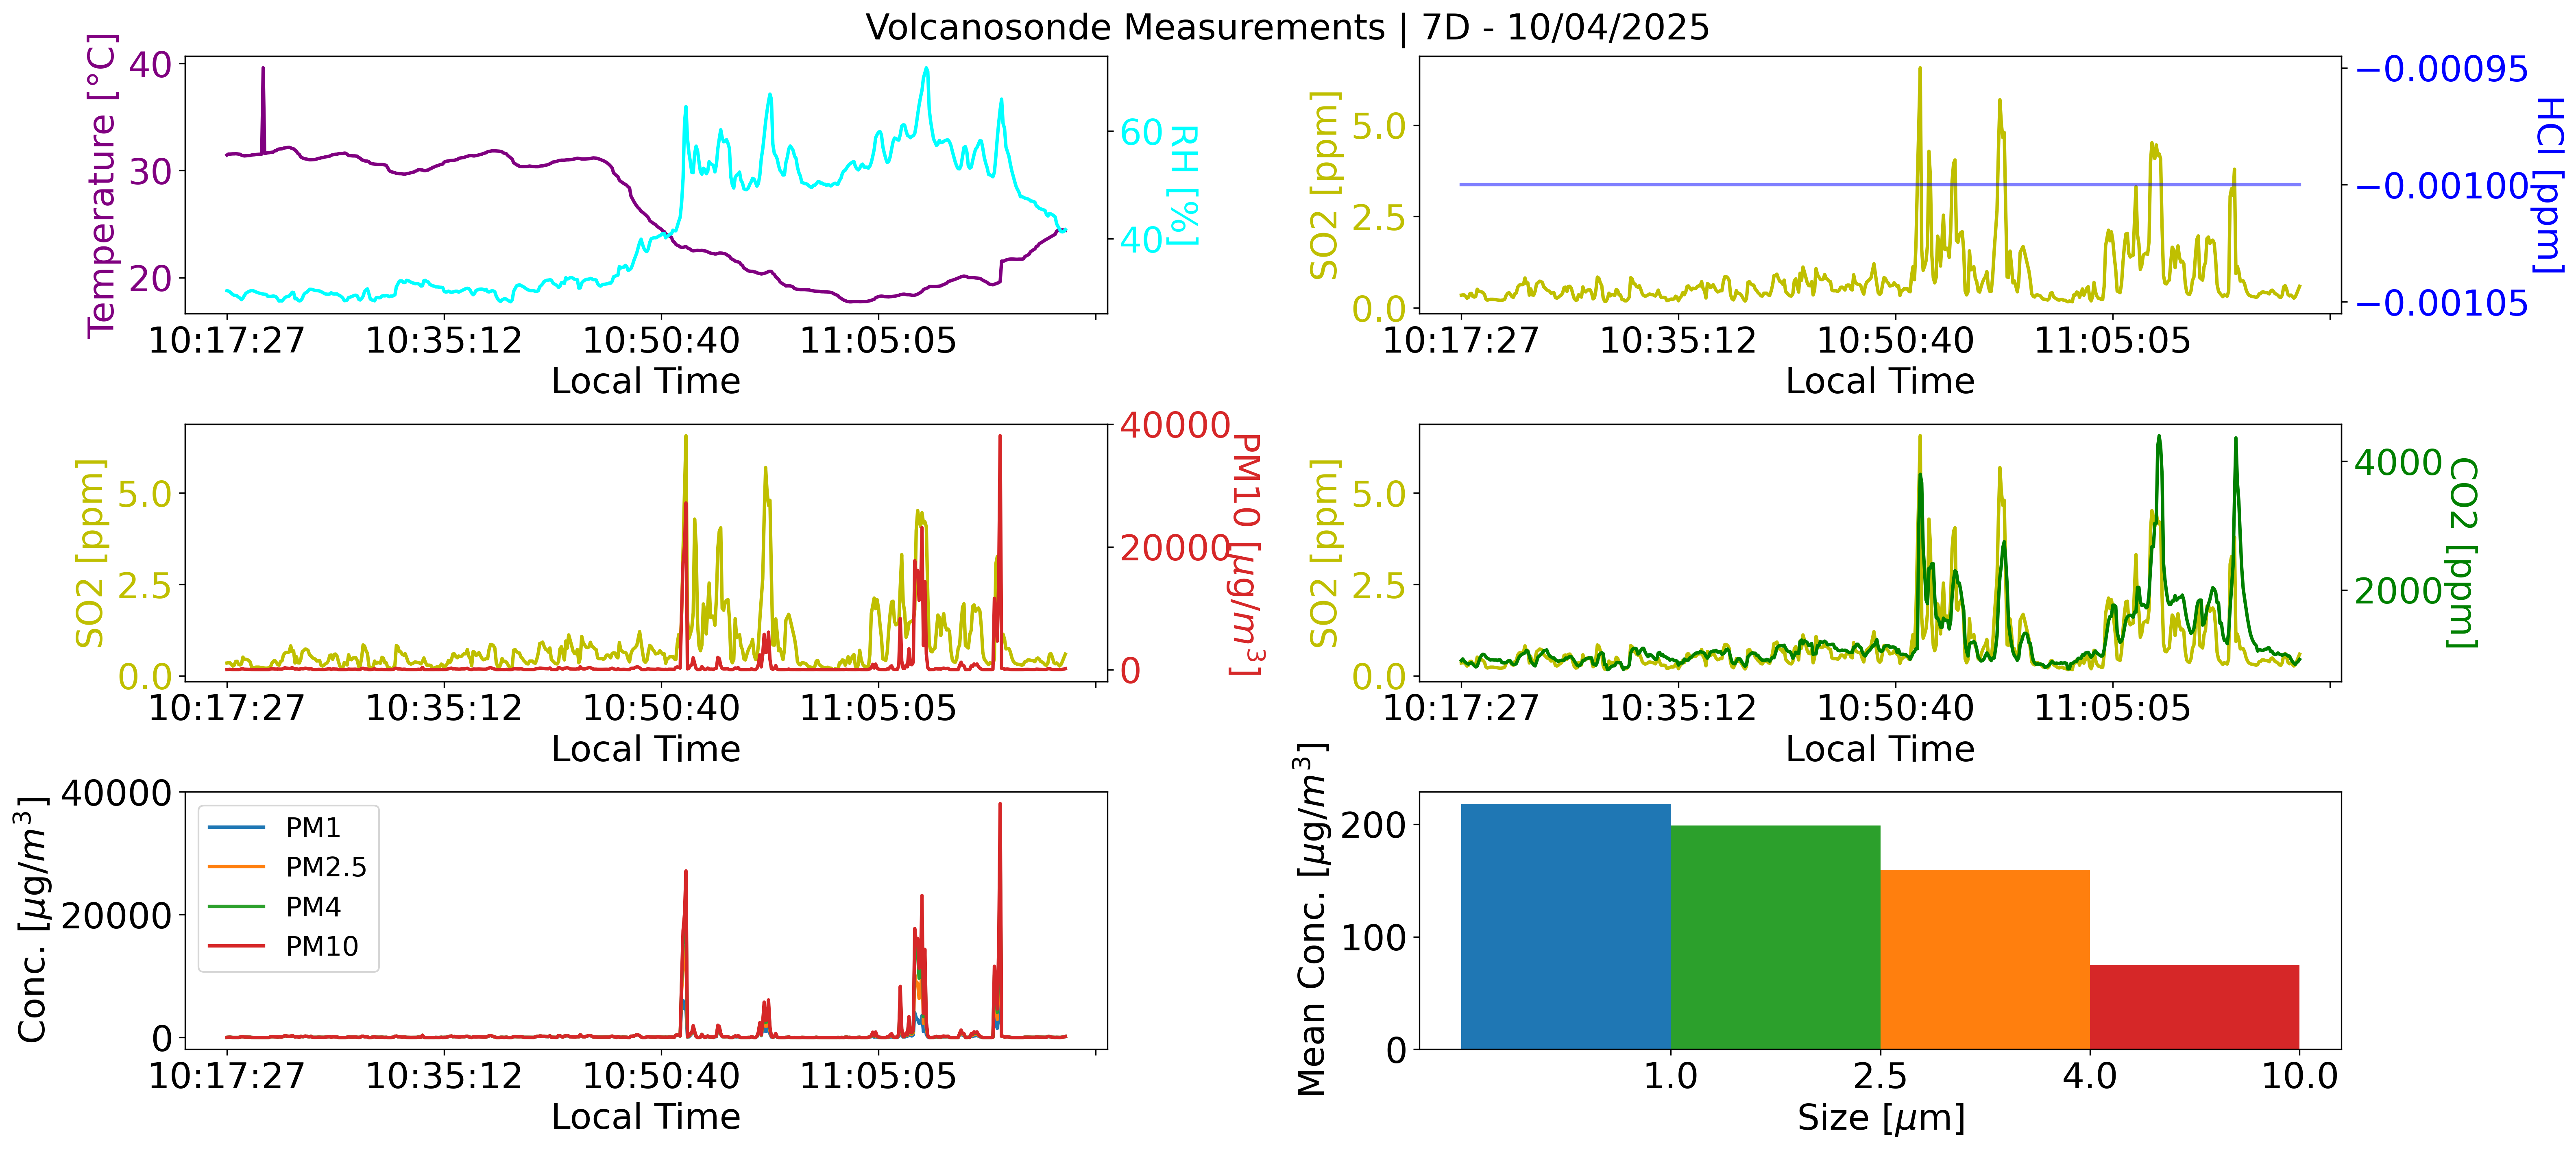 Figure 4. Volcanosonde measurements from 10 April 2025 (7D).
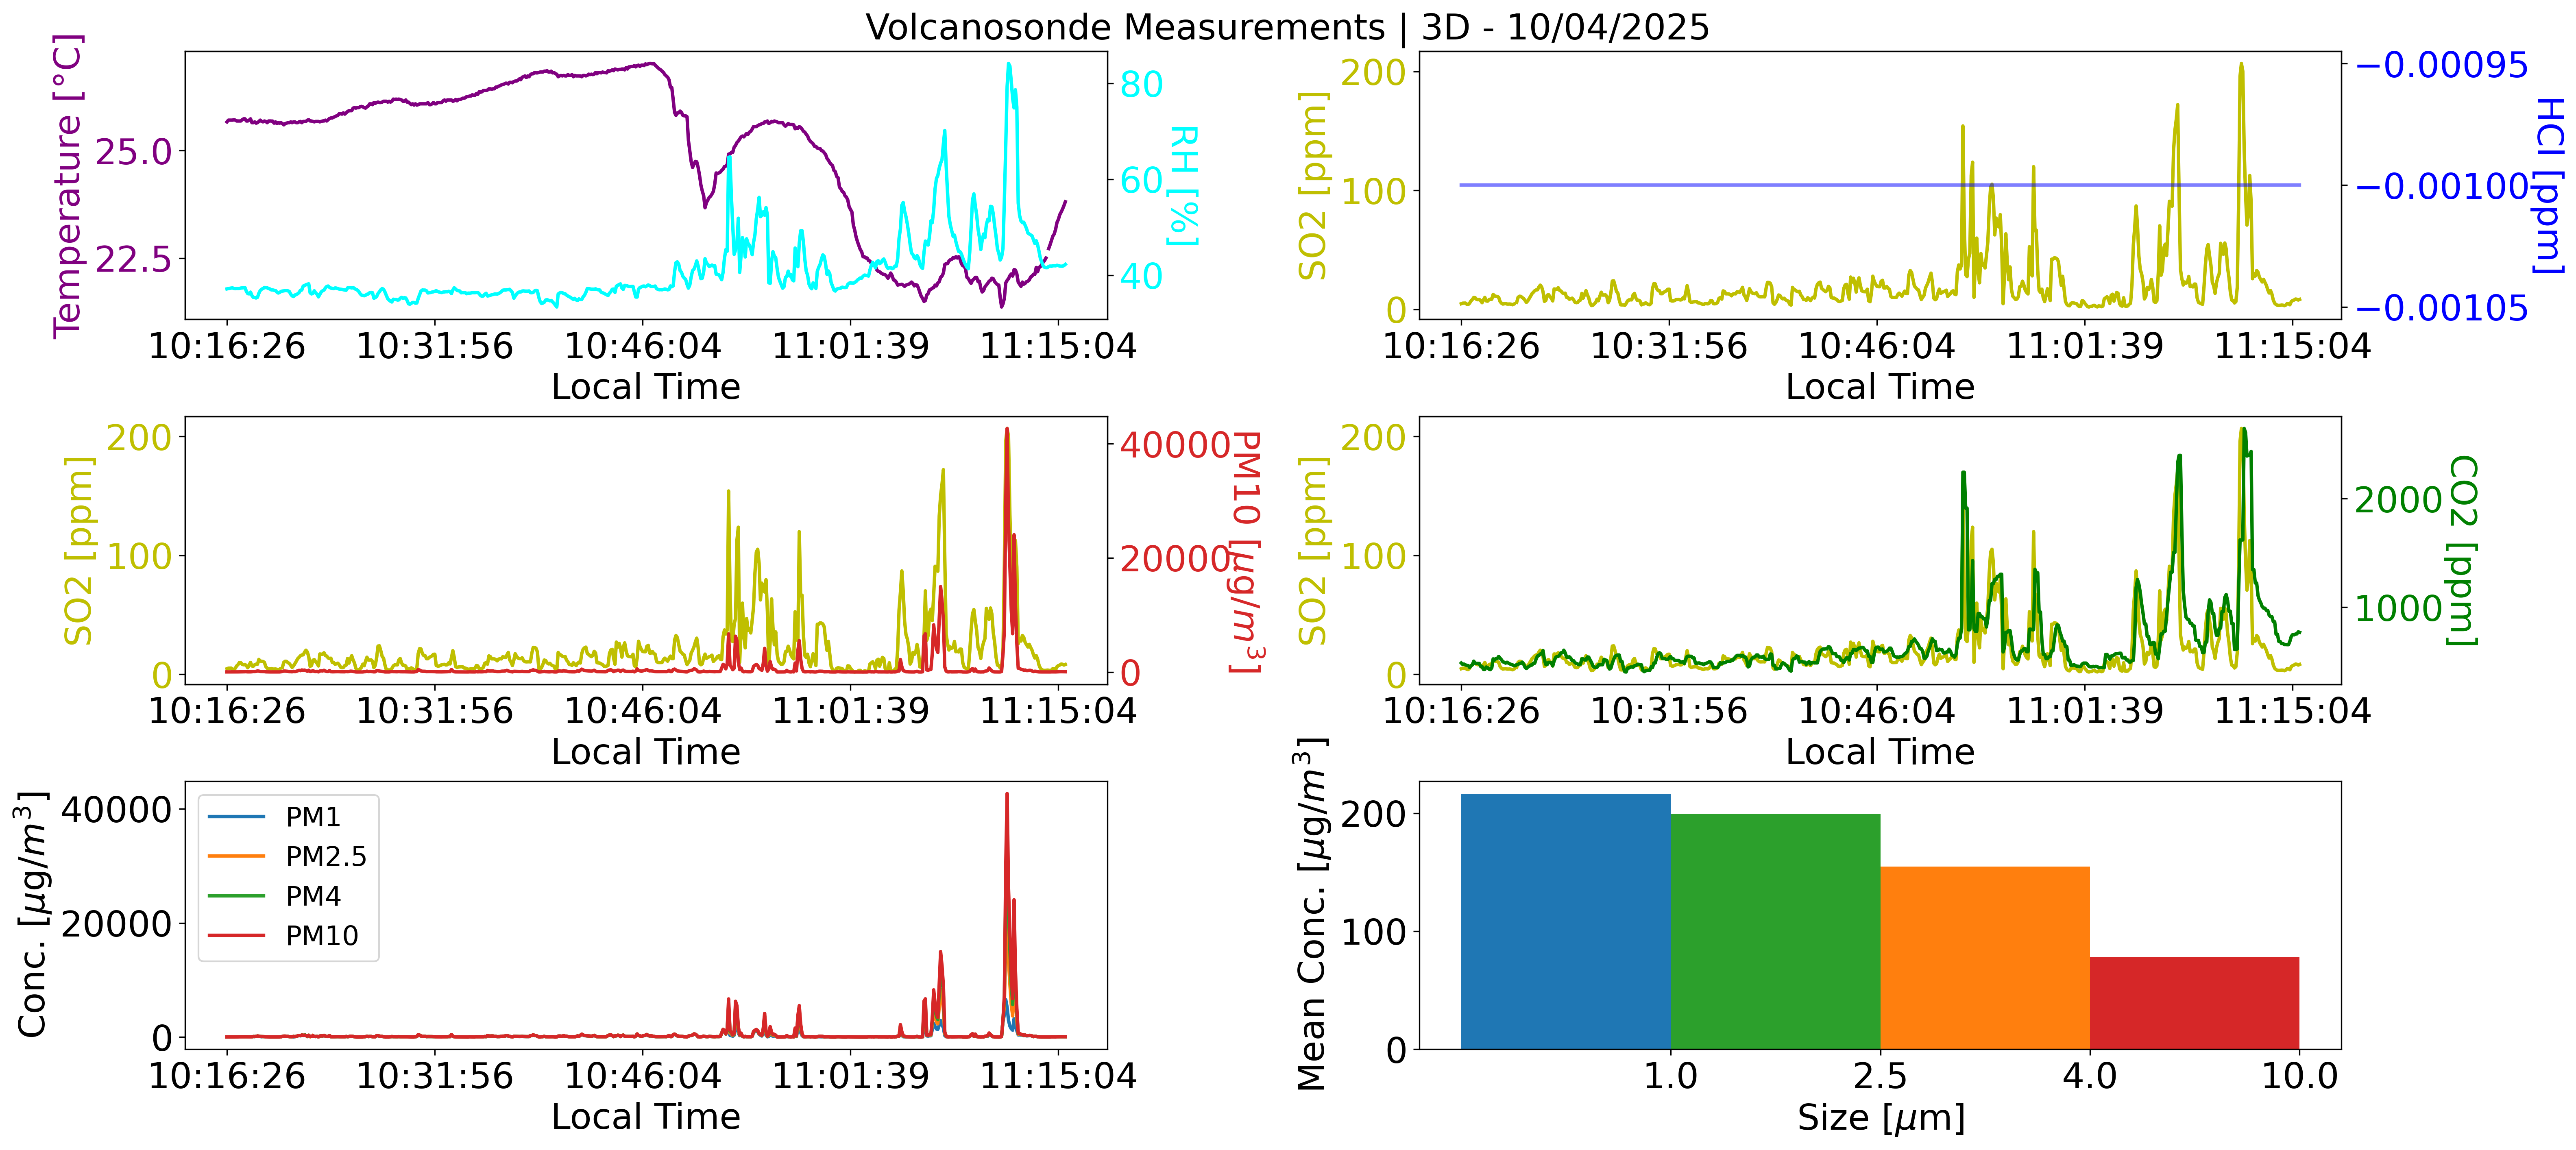 Figure 5. Volcanosonde measurements from 10 April 2025 (3D).
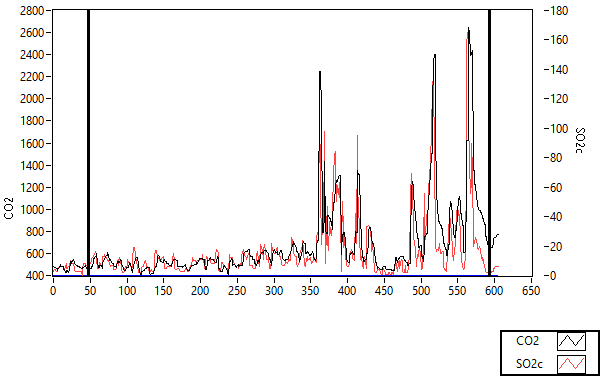 Figure 6. CO2 and SO2 measurements were aligned using the point of maximum correlation. The analysis was performed using RatioCalc 3.2 software.
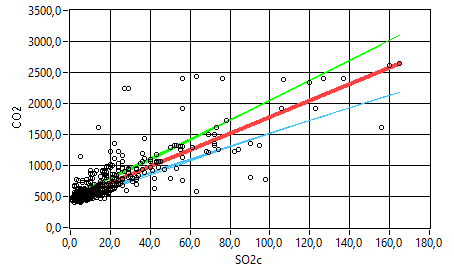 Figure 7. CO2 and SO2 correlation plot. The analysis was performed using RatioCalc 3.2 software.
- Cross-comparison
Table 3 summarizes the instruments that were present in each day for the measurements and the cross-comparison.
|
Date |
Instrument |
|
8 April 2025 |
Volcanosonde MiniGas - NTX |
|
9 April 2025 |
Volcanosonde MiniGas – NTX Multi-GAS |
|
10 April 2025 |
Volcanosonde MiniGas – NTX Multi-GAS |
Table 3. The instruments that were present for the cross-comparison per day.
- 08 April 2025
On this day, measurements using the Volcanosonde were taken simultaneously with the MiniGAS instrument (Silvestri et al., 2023). The SO₂ and CO₂ comparison measurements are shown in Figures 8 and 9, respectively. Even if the volcanosonde sensors were not calibrated, both the correlation and absolute values of SO2 measurements are in agreement. A good correlation is also found for CO2 but the absolute values are meaningfully different. For this latter, the lack of calibration induced an overestimation due to the environmental CO2.
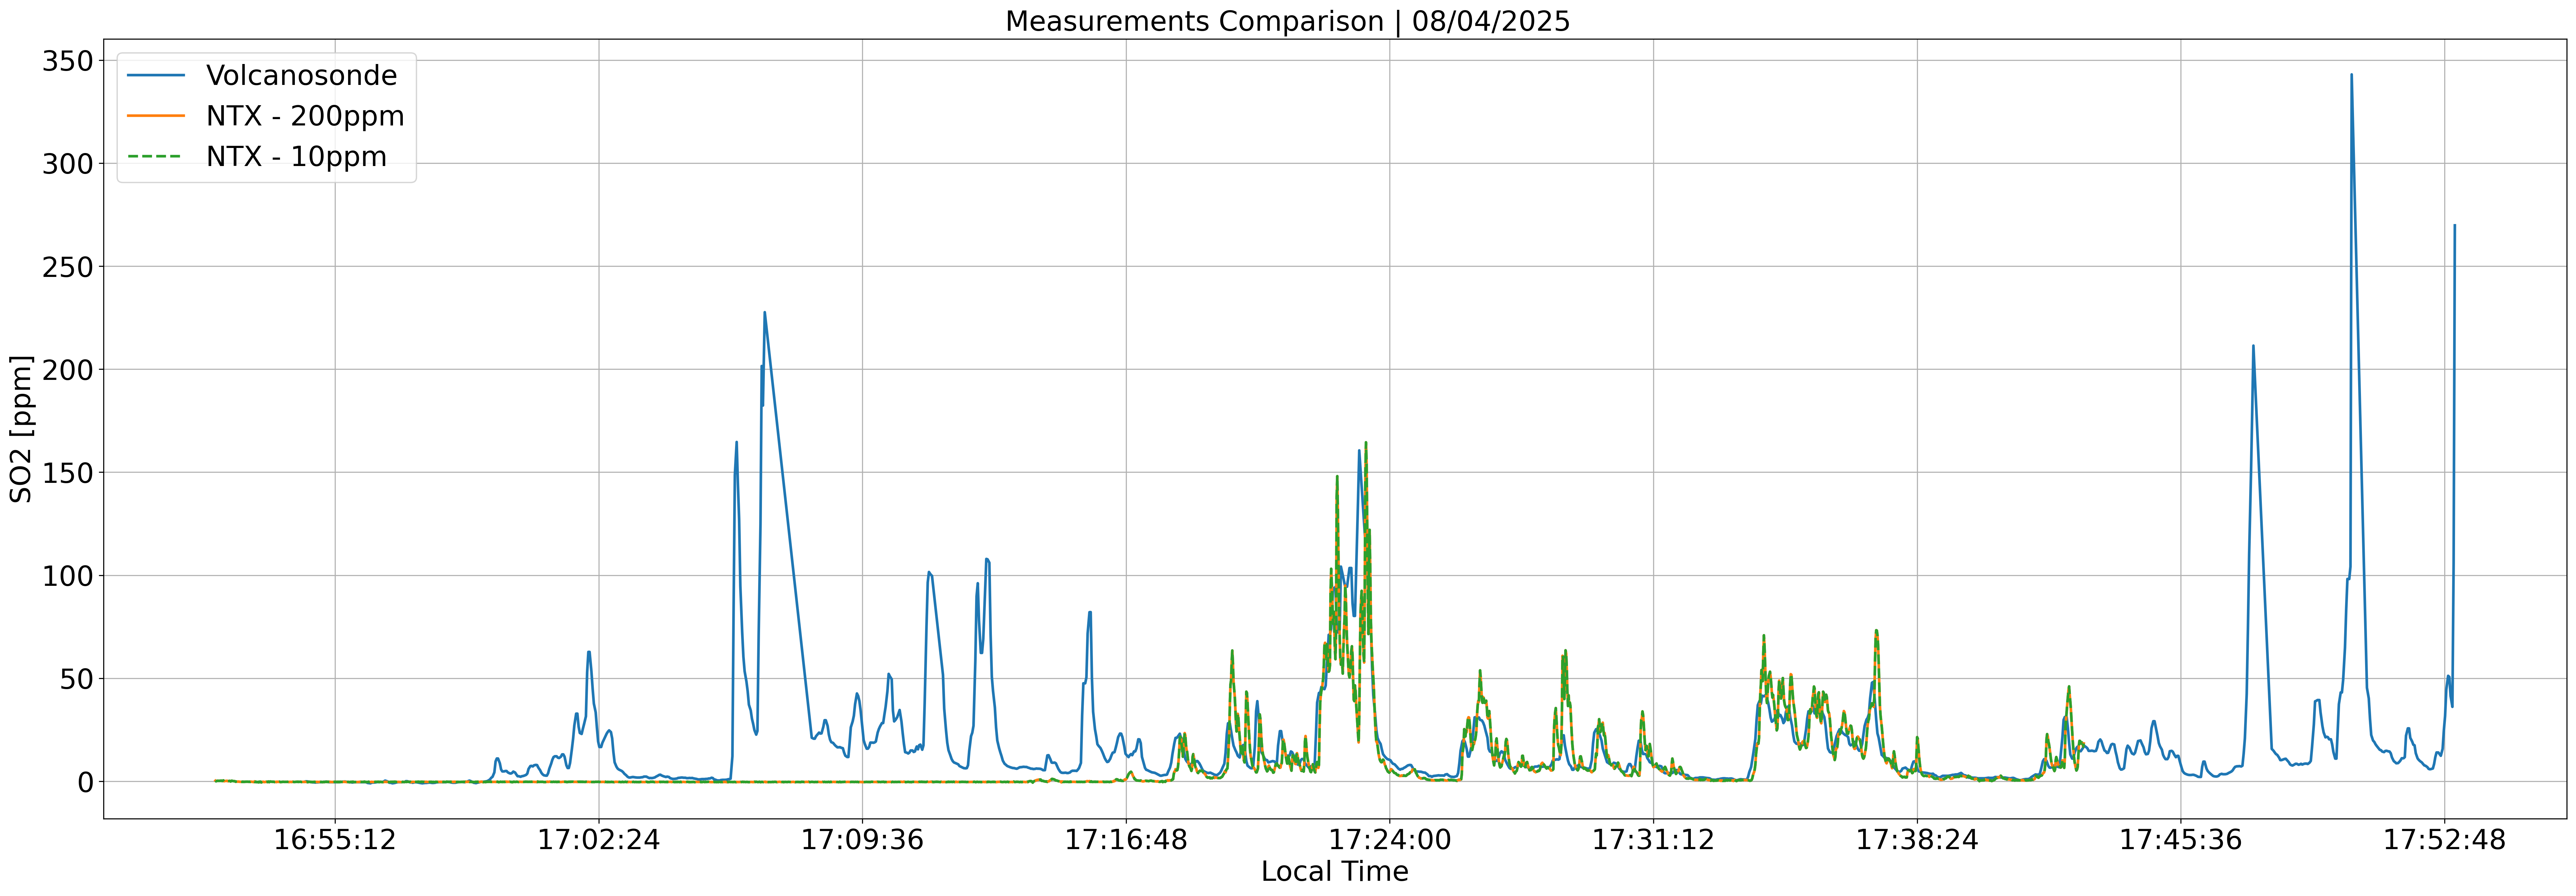 Figure 8. SO₂ data comparison between the Volcanosonde and NTX MiniGAS instruments.
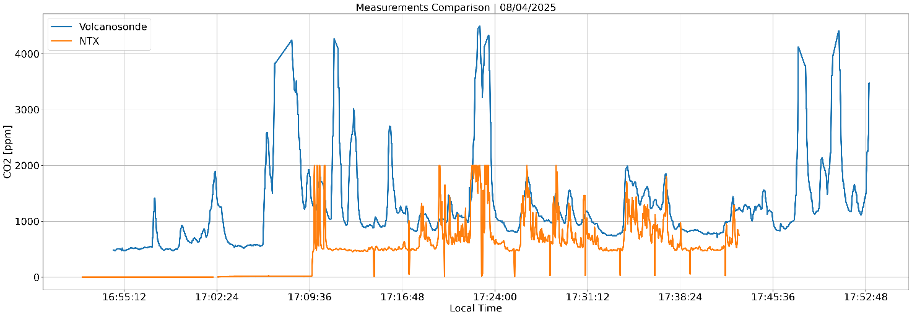
Figure 9. CO₂ data comparison between the Volcanosonde and NTX MiniGAS instruments.
- 09 April 2025
The measurements taken with the Volcanosonde on this day are not suitable for comparison.
- 10 April 2025
On this day, measurements using the Volcanosonde 7D were taken simultaneously with the MiniGAS, MultiGAS and MultiGAS-PP2 instruments. The SO₂ and CO₂ comparison measurements are shown in Figures 10 and 11, respectively. Although the MiniGAS data is not yet included in the comparison plots, the measurements from the MultiGAS and MultiGAS-PP2 instruments show a strong correlation between CO₂ and SO₂ in particular for the low values. The high values have been found while crossing the main fumaroles on foot (see Figure 12). The crossing was done by carrying the instruments in hand and walking in a single file. The discrepancies are therefore due to the fact that the sampled gas is not the same.
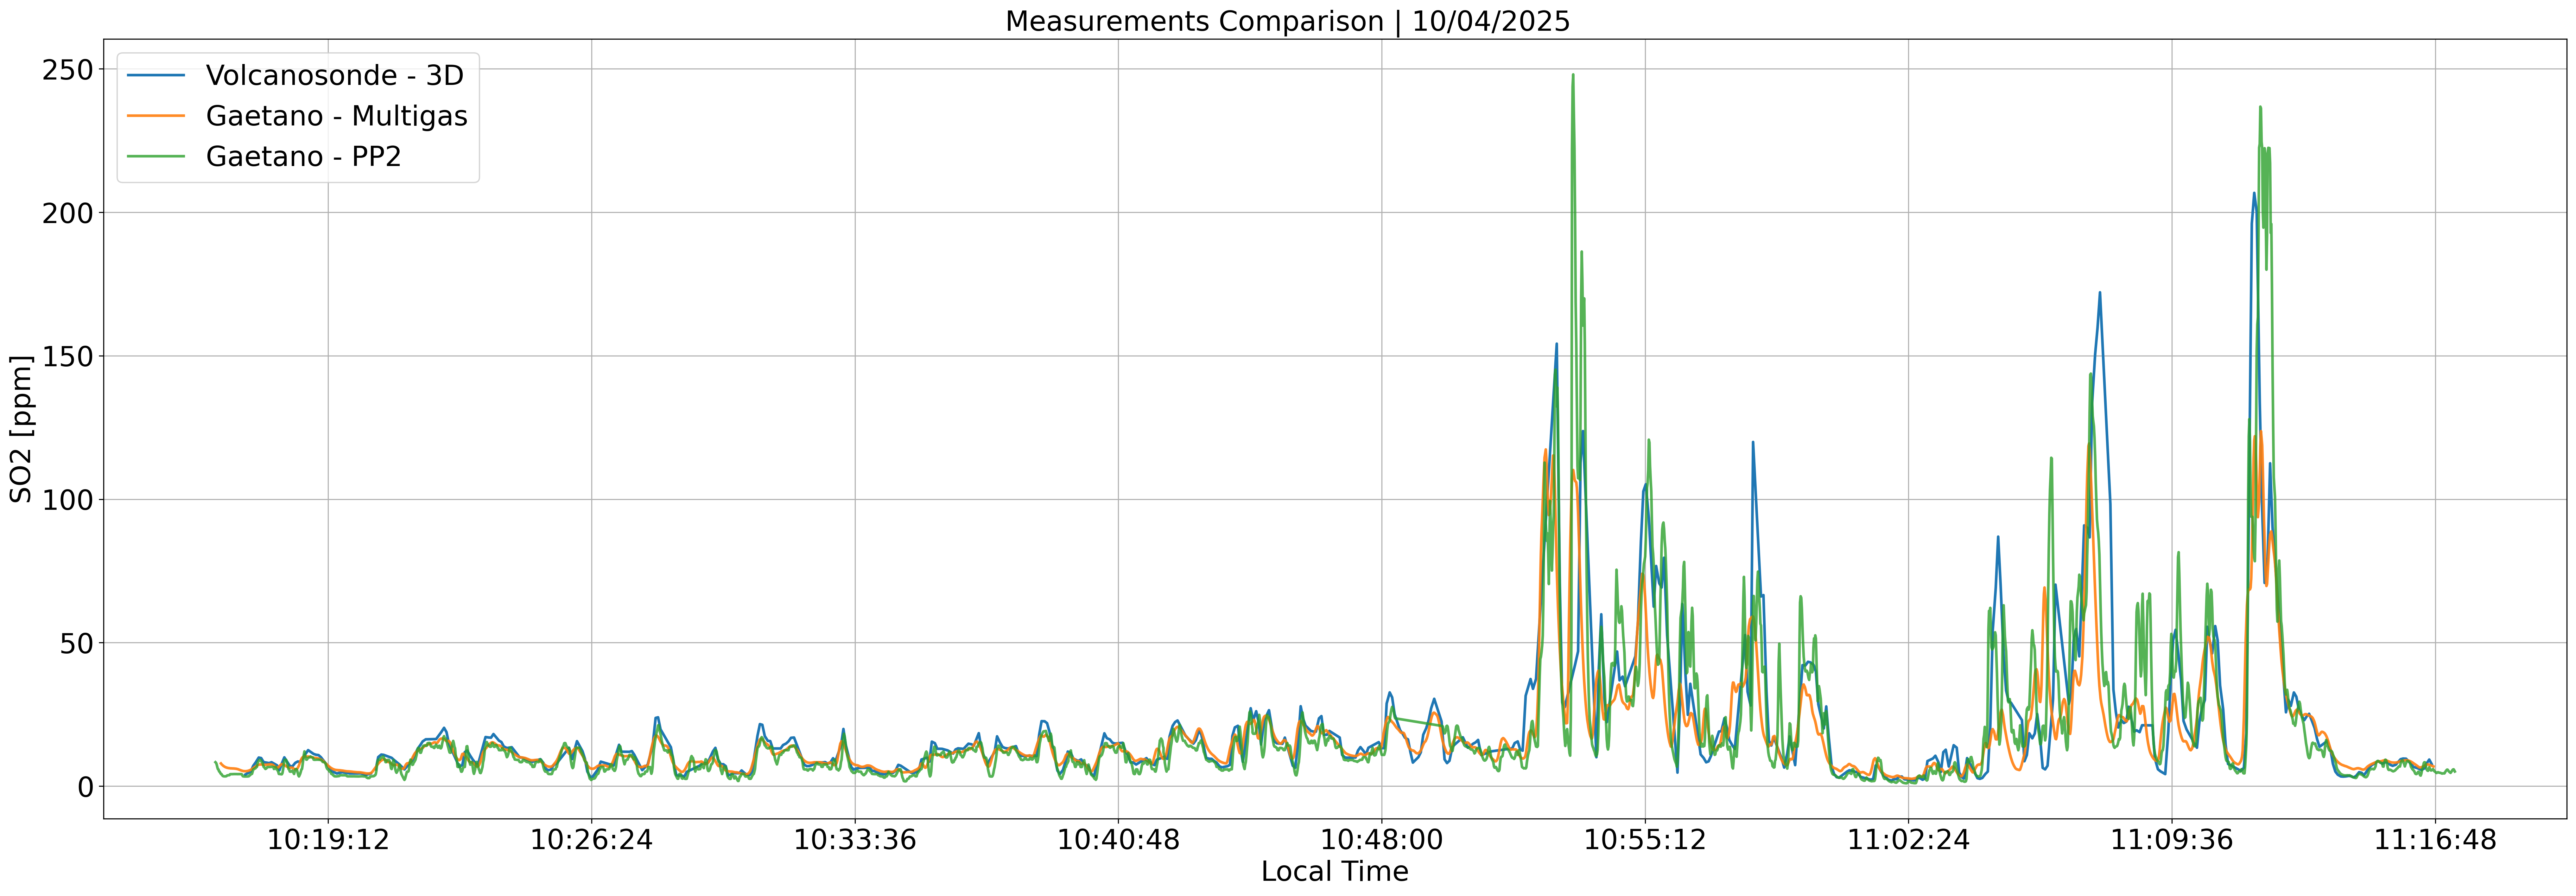 Figure 10. SO₂ data comparison between the Volcanosonde and Gaetano MultiGAS instruments.
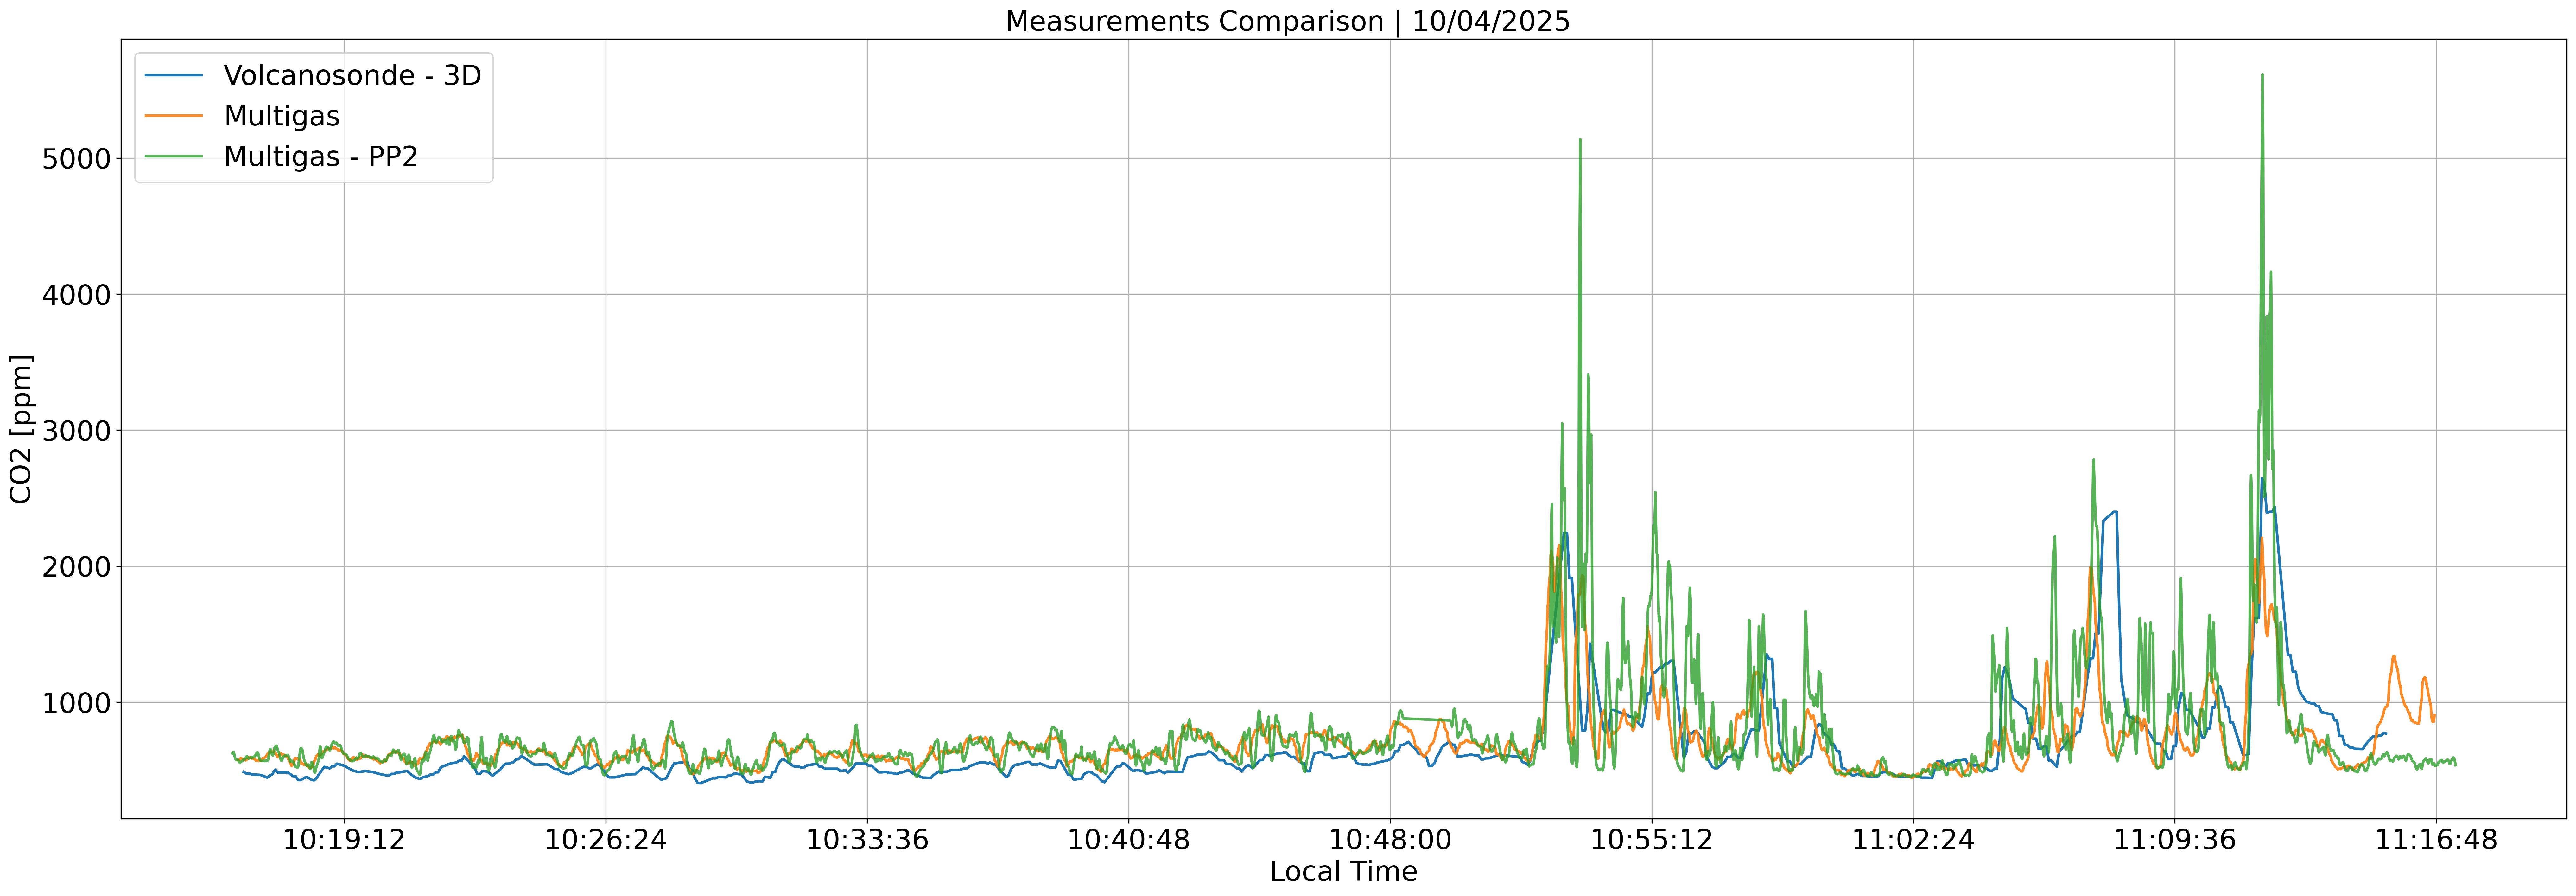 Figure 11. CO₂ data comparison between the Volcanosonde and Gaetano MultiGAS instruments.
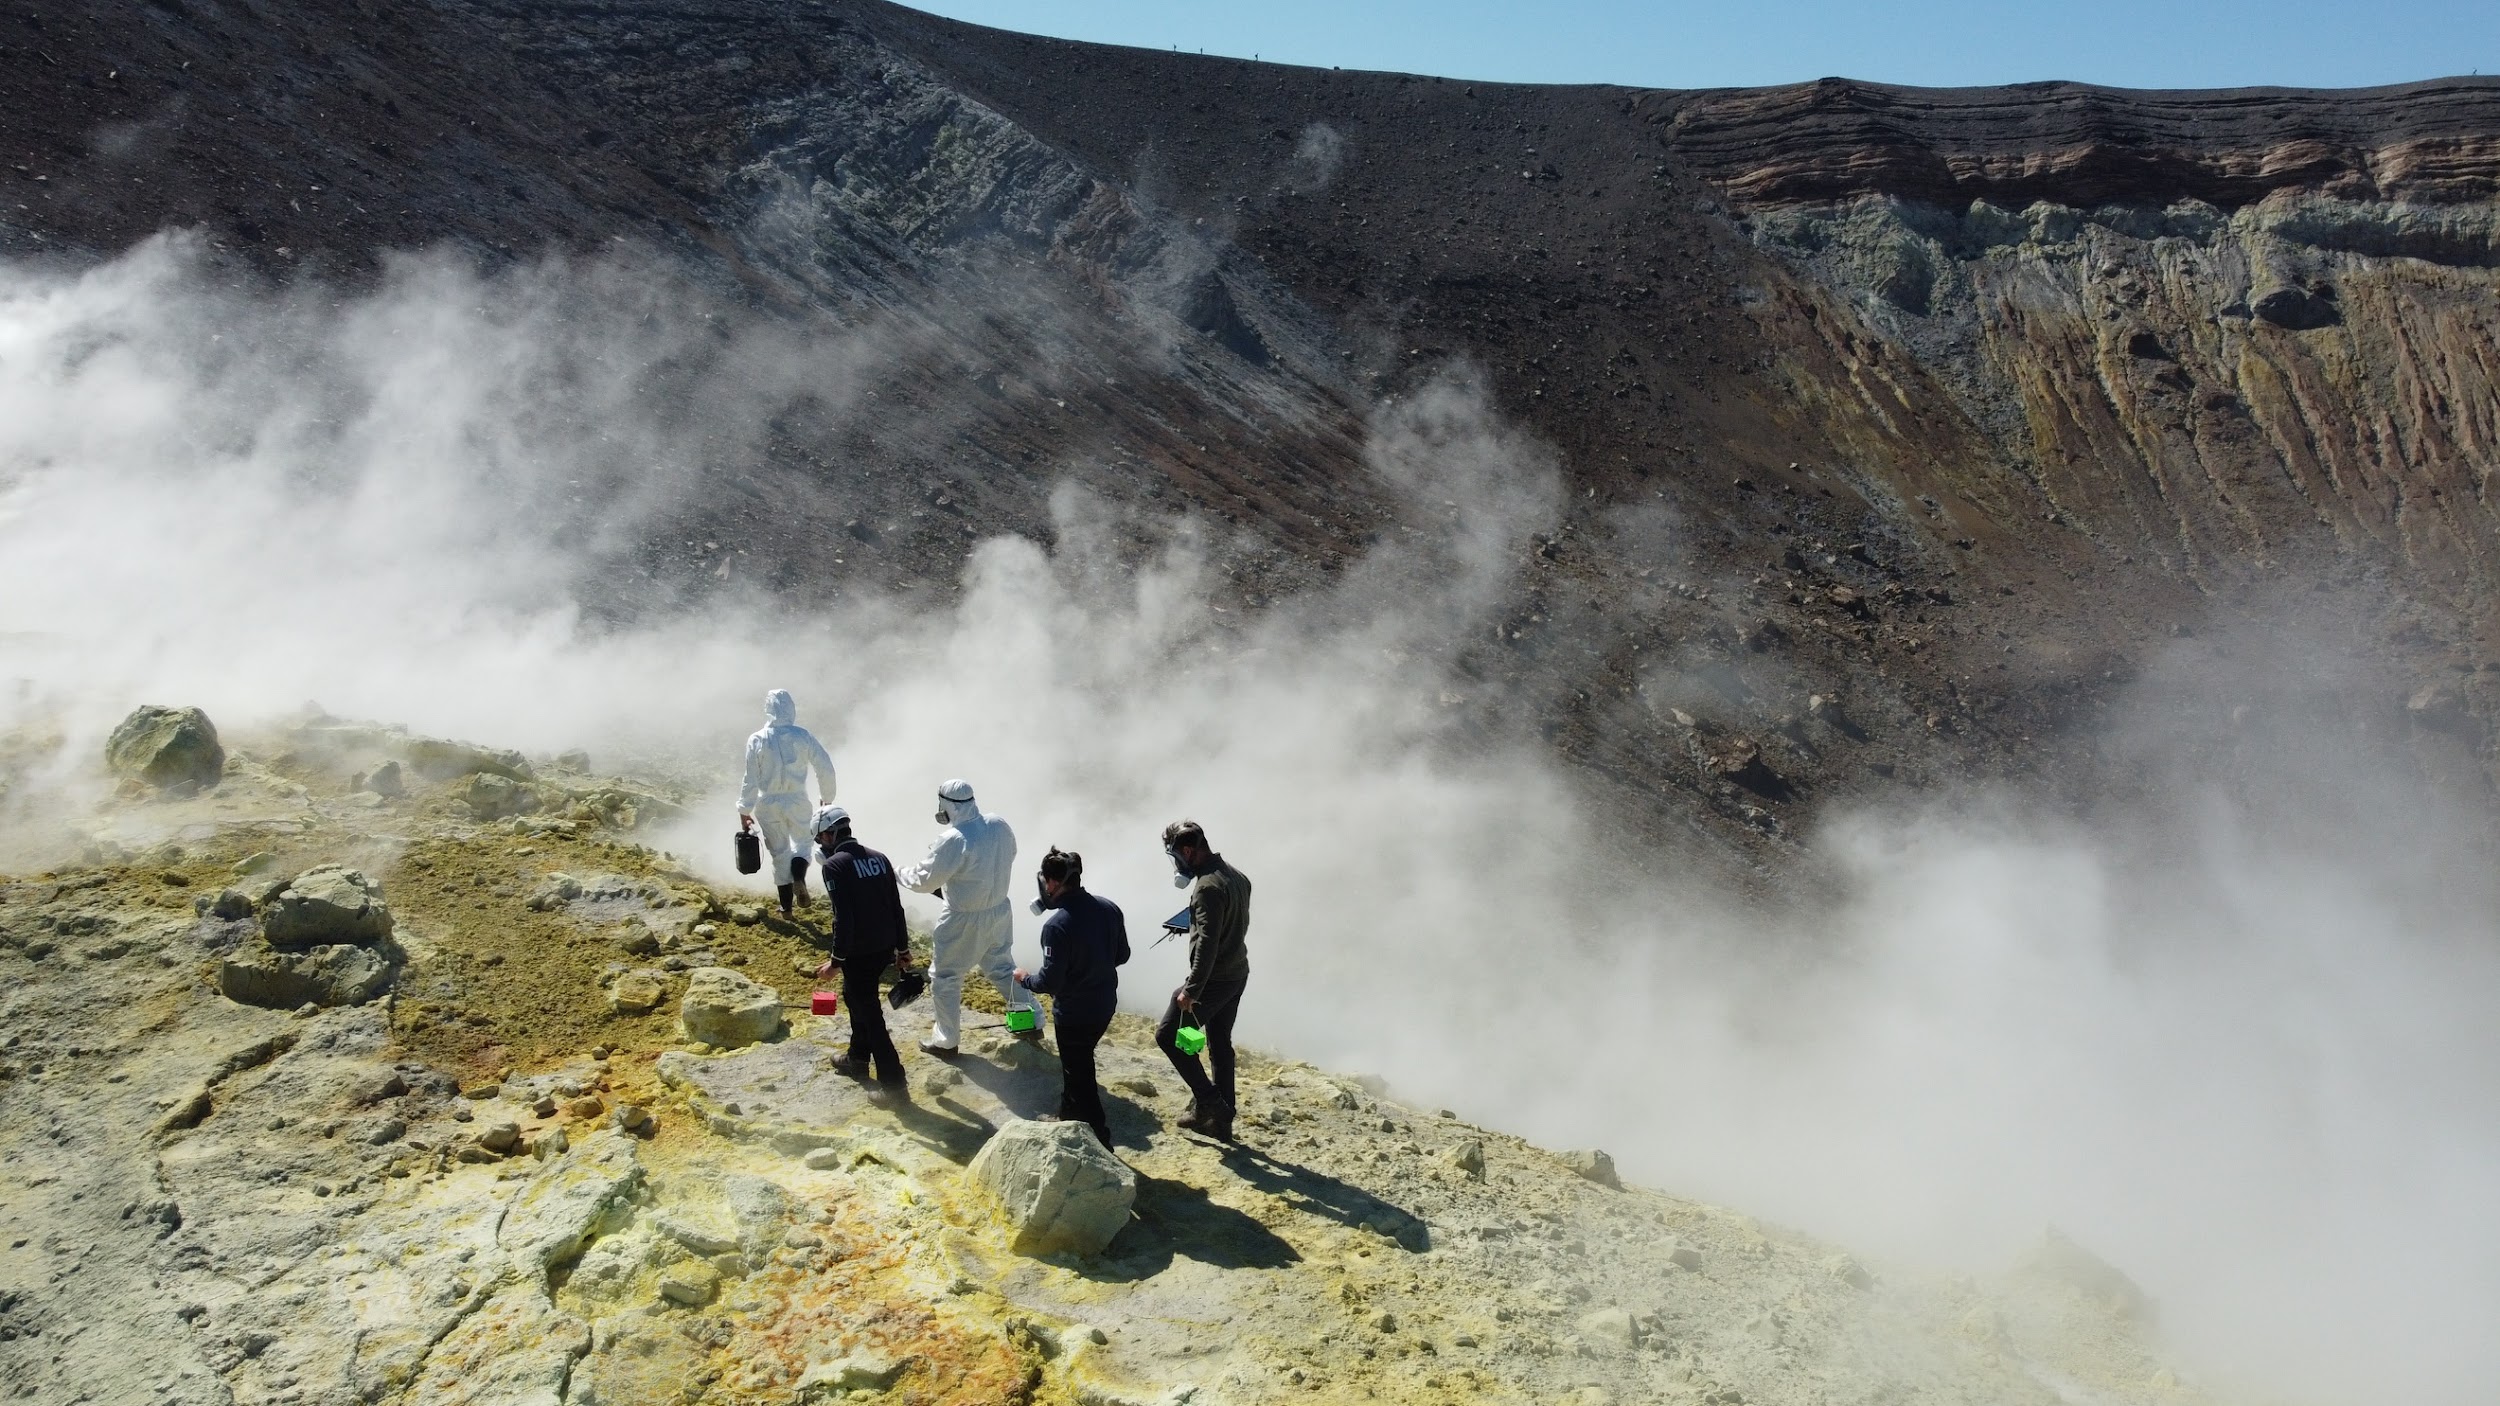 Figure 12. Gas sampling into the main fumaroles
By analyzing the correlation coefficient (R²) and the CO₂/SO₂ ratio for both the MultiGas and MultiGas --PP2 instruments—as was done in Section 1.3 for the Volcanosonde—we observed the following in the Table 4:
|
Instrument |
R² |
SO₂/CO₂ ratio |
|
Volcanosonde 3D |
0,70 |
13,2 |
|
Gaetano - Multigas |
0,97 |
13,5 |
|
Gaetano - PP2 |
0,94 |
14,2 |
Table 4. The correlation coefficient (R²) and the SO₂/CO₂ ratio comparison.
- SO2 sensors calibration
Table 5 shows a summary of the SO₂ sensor calibration, which was carried out in the Laboratory of the University of Palermo. From Table 2, it can be concluded that the mean percentage error of the measured values is approximately 18%.
|
Serial number |
Gas |
Reference [ppm] |
Variance [ppm] |
Measured [ppm] |
Flux |
Bias |
Percent error [%] |
|
56022520023 |
SO2 |
30 |
+-4% |
34,6 |
1 l/minuto |
80 ppb |
15,33 |
|
56022520022 |
SO2 |
30 |
+-4% |
34,6 |
1 l/minuto |
0,3 ppm |
15,33 |
|
56022520021 |
SO2 |
30 |
+-4% |
31,8 |
1 l/minuto |
0,3 ppm |
6,00 |
|
56022520019 |
SO2 |
30 |
+-4% |
34,9 |
1 l/minuto |
0.2 ppm |
16,33 |
|
56022520020 |
SO2 |
30 |
+-4% |
36,4 |
1 l/minuto |
0,2 ppm |
21,33 |
|
56022520017 |
SO2 |
30 |
+-4% |
36,2 |
1 l/minuto |
0,2 ppm |
20,67 |
|
56022520018 |
SO2 |
30 |
+-4% |
35,7 |
1 l/minuto |
0,2 ppm |
19,00 |
|
SO2 |
5 |
+-4% |
6,3 |
1 l/minuto |
0,1 ppm |
26,00 |
|
|
SO2 |
88,4 |
+-4% |
106,5 |
1 l/minuto |
- |
20,48 |
Table 5. Summary of SO2 sensor calibration.
References
Aiuppa, A., Federico, C., Giudice, G., & Gurrieri, S. (2005). Chemical mapping of a fumarolic field: La Fossa Crater, Vulcano Island (Aeolian Islands, Italy). Geophysical Research Letters, 32(13), 1–4. https://doi.org/10.1029/2005GL023207
Corradini S., Marcuccio S., Biondi R., Ciancitto F., Filippeschi A., Giudice G., Gemignani M., Guerrieri L., Marsili I., Merucci L., Naranjo C., Scollo S., Stelitano D., “Volcanic plume gases and particles characterization using sounding balloons: the VOLANDO project”, Abstract V33B-3104, AGU 2024, Washington, D.C. (USA) 9 - 13 December 2024.
Silvestri, M., Diaz, J. A., Rabuffi, F., Romaniello, V., Musacchio, M., Corrales, E., Fox, J., Marotta, E., Belviso, P., Avino, R., Avvisati, G., & Buongiorno, M. F. (2023). MultiGAS Detection from Airborne Platforms on Italian Volcanic and Geothermal Areas. Remote Sensing 2023, Vol. 15, Page 2390, 15(9), 2390. https://doi.org/10.3390/RS15092390
Tamburello, G. (2015). Ratiocalc: Software for processing data from multicomponent volcanic gas analyzers. Computers & Geosciences, 82, 63–67. https://doi.org/10.1016/J.CAGEO.2015.05.004