
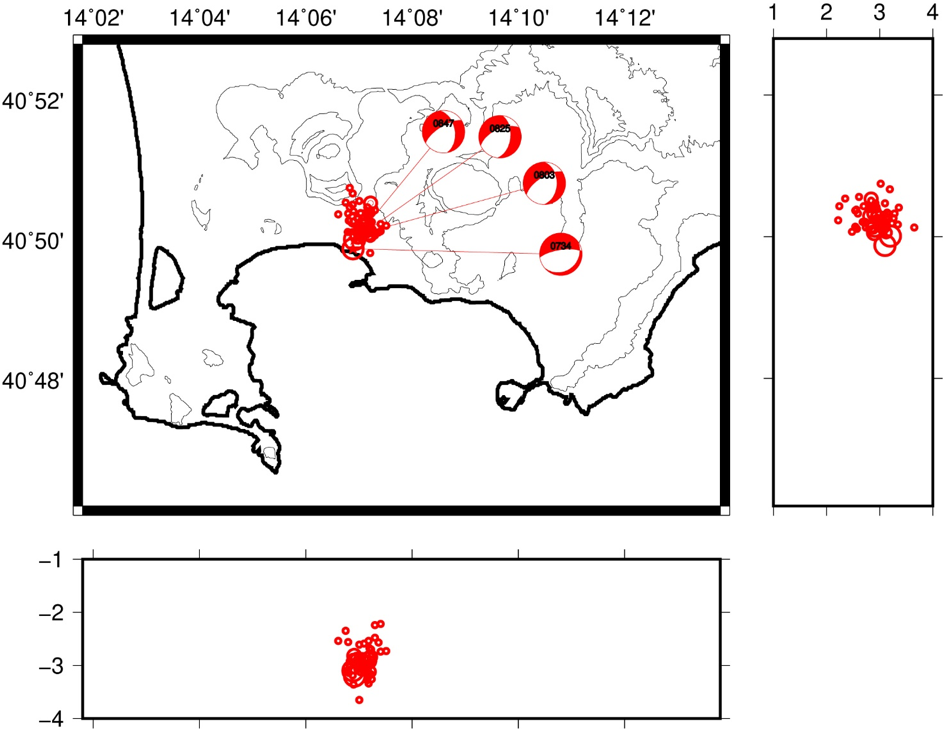
Location of the earthquakes of the swarm of 7/9/2012 using the NLLoc program with a 3D velocity model.. Circle sizes are proportional to the earthquake magnitude. The beach balls are obtained using the program FPFit. The numbers within the beach balls indicate the minutes and seconds of the earthquake occurrence.
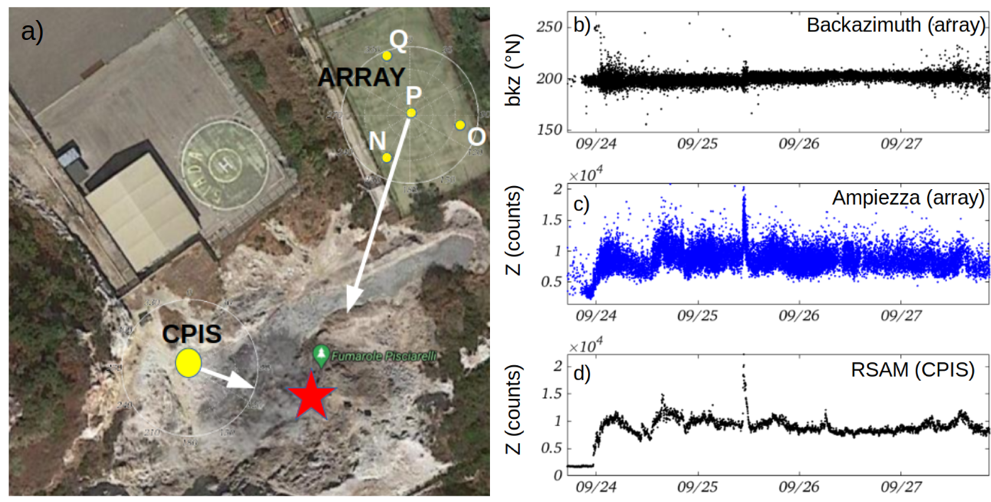
Position of the seismic array deployed during the temporary experiment, and position of CPIS permanent seismic station. Arrows indicate the direction of provenance of the signal derived from FK and polarization analysis. Red star indicates the position of the Pisciarelli boiling pool; b) back-azimuth and c) seismic amplitude associated with seismic array detections indicate a stationary and fixed seismic source. d) Seismic amplitude measured at CPIS permanent seismic stations show an extreme coherence with detection amplitude derived from array analysis.
Task 3.1:
We reconstructed the history of the seismic network of Osservatorio Vesuviano since 2012 to evidence any station variation that could give anomalies in the cross correlation analysis. We organized the data set and configured a work station where to allocate the analysed data. We computed the cross correlation on the vertical component of the seismic records within different frequency bands. For the analysis we selected 20 stations of the permanent seismic network of Osservatorio Vesuviano. Not all of them have been working since 2012. We performed the cross correlations for all the couple of stations in the overlapping working periods. The correlations have been stored to be used for the tomographic analysis. Some correlations show picks that needs to be better analysed. We are going to analyse the cross correlation functions in terms of path characteristics.
Task 3.2:
We statistically analyzed the seismic catalogue of Campi Flegrei from 2000 to 2020 to understand the temporal variations of seismic parameters and correlated them with the trend of the geochemical parameters estimated from the fumarolic gases recorded at Solfatara and with the deformations of the central part of the caldera. A detailed analysis of the Mc of the whole catalogue, with a particular attention to its variations with time and space, has been. The analysis of the catalogue was accompanied by the simultaneous computation of the theoretical sensitivity analysis of the seismic network to corroborate the empirical results and to have an Mc estimate also for the areas of the caldera where the seismicity was too low to allow an empirical estimate. From August 2000 to April 2020 about 1700 earthquakes have been recorded. Most of them are located in the Solfatara/Pisciarelli area and we estimated a b value of 0.92 ± 0.03 for the whole period. A decrease in the average inter-distance and in the average depth is evident since the end of 2015, around October 7, when a swarm occurred at the end of a period of uplift increment that stopped in coincidence with the swarm itself. All the analyses are well described in Tramelli et al. (2021) where the authors led back to a common cause for all the temporal variation of the observable taken into consideration. The fluid heating or its pressurization, clearly revealed by the CO/CO2 increase in time, can indeed cause all the monitored anomalies. Injection of magmatic fluids within the hydrothermal system which feeds the Solfatara/Pisciarelli fumaroles would heat up the system increasing the pore pressure and facilitating the earthquakes occurrence being the medium less prone to bear stress and being the faults lubricated.
In addition, we analysed in detail six main swarms recorded in Campi Flegrei occurred in 2000, 2012, 2015, 2018, 2019 and 2020 in order to contribute to the understanding of the processes involved in the long term unrest of this densely populated caldera. We re-located the earthquakes and estimated the focal mechanisms of the higher-magnitude ones within these swarms. We compared the locations and focal mechanisms with the fault systems of the caldera and with the tomographic images and we found a good agreement between them. The focal mechanisms are in agreement with the tensional stress induced by the uplift of the central part of the caldera.
Task 3.3:
We conducted a temporary seismic array measurements at Pisciarelli fumarolic field in order to investigate the seismic source process which generate seismic tremor and its relationship with fumarolic outgassing. We deployed a small aperture 4-element 3D seismo-acoustic array equipped with Lennartz 3D-1s seismometers at a distance of ~40m from the fumarolic field. We characterized the seismic wavefield produced by Pisciarelli fumarolic field in terms of back-azimuth, slowness and associated amplitudes. Array data processing on seismic signals allowed to define the coherent data of the measured ground motion from a fixed or a moving source, and, in addition, allows to define the direction of provenance of the seismic wavefield through time and space. The recorded seismc wavefield observed at Pisciarelli can be traced back to a persistent and fixed source located at ~200°N from the array, which is consistent to the position of the fumarolic field. The comparison of the array measurements with the records of the permanent seismic station of the network of Osservatorio Vesuviano CPIS, used as the reference station for fumarolic tremor monitoring, shows an extreme coherence and similarity of the mutual amplitude fluctuations (Giudicepietro et al., 2019). Array analysis also allowed to derive the “apparent velocity” parameter (the inverse of slowness) associated with incident seismic wavefield which gives information on the depth position of the radiating source. The seismic wavefield recorded at Pisciarelli is associated with an apparent velocity of 300-400 m/s, which indicates a very shallow position of the source propagating mainly on the horizontal plane.