
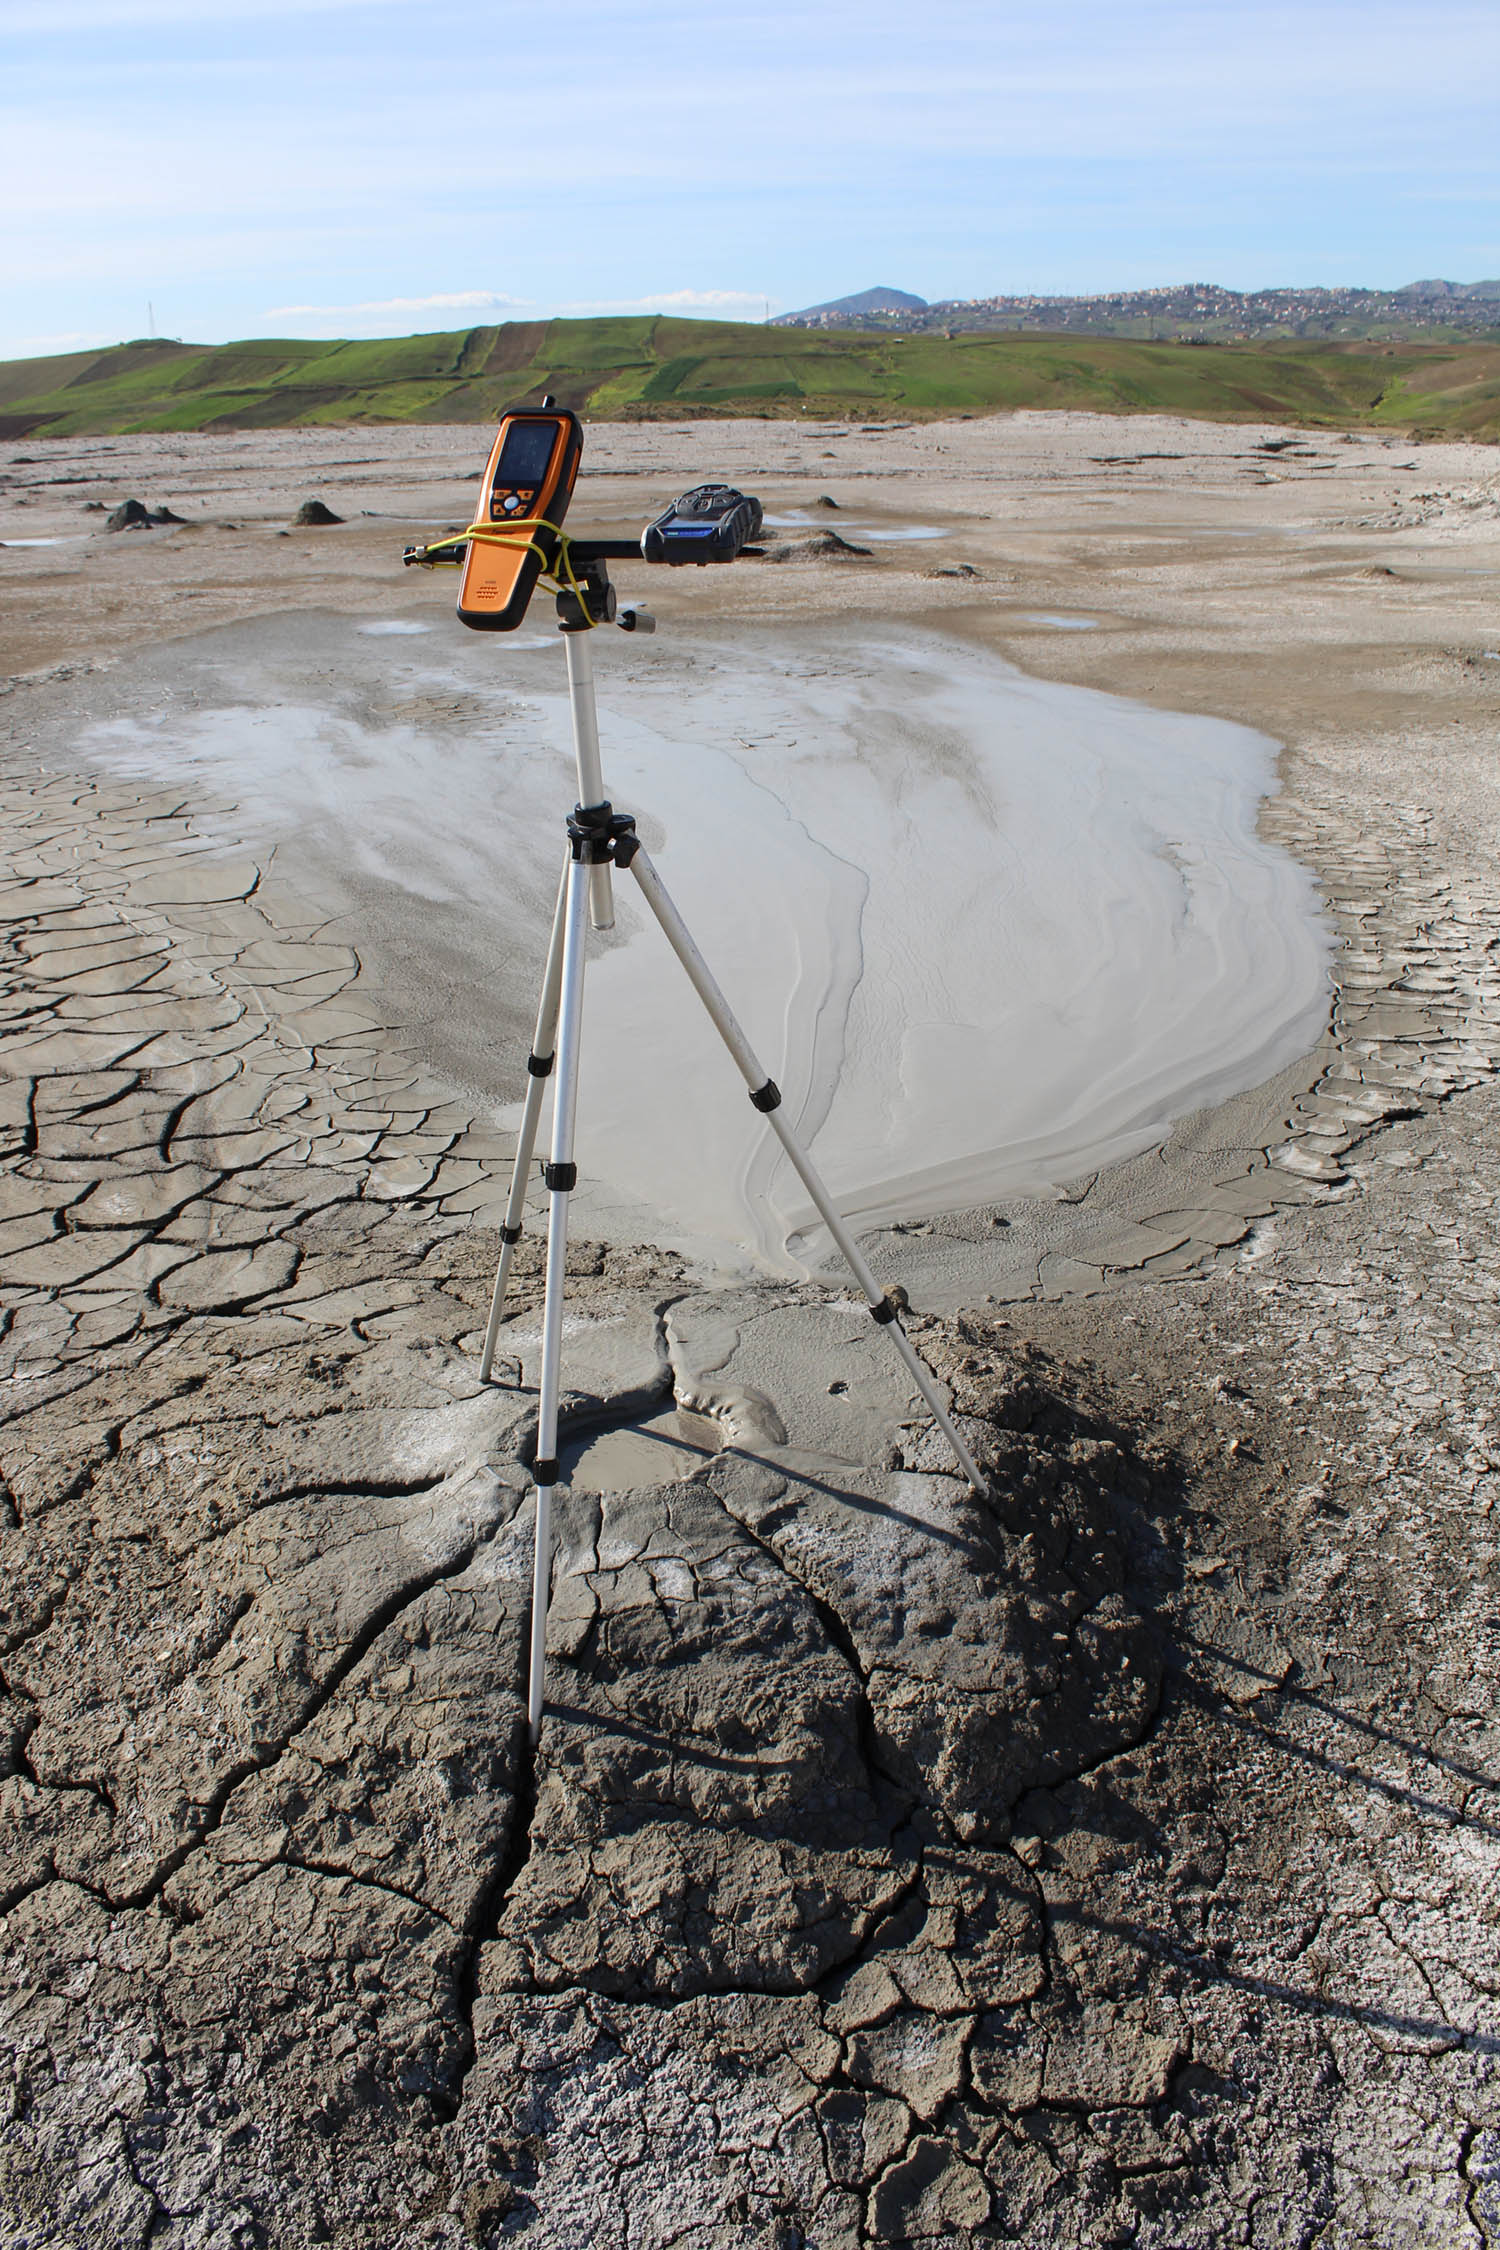
Picture 1. 16 February 2022: Measurements of atmospheric concentrations of methane, carbon dioxide, carbon monoxide and hydrogen sulphide at Maccalube d’Aragona (Sicily, Italy).
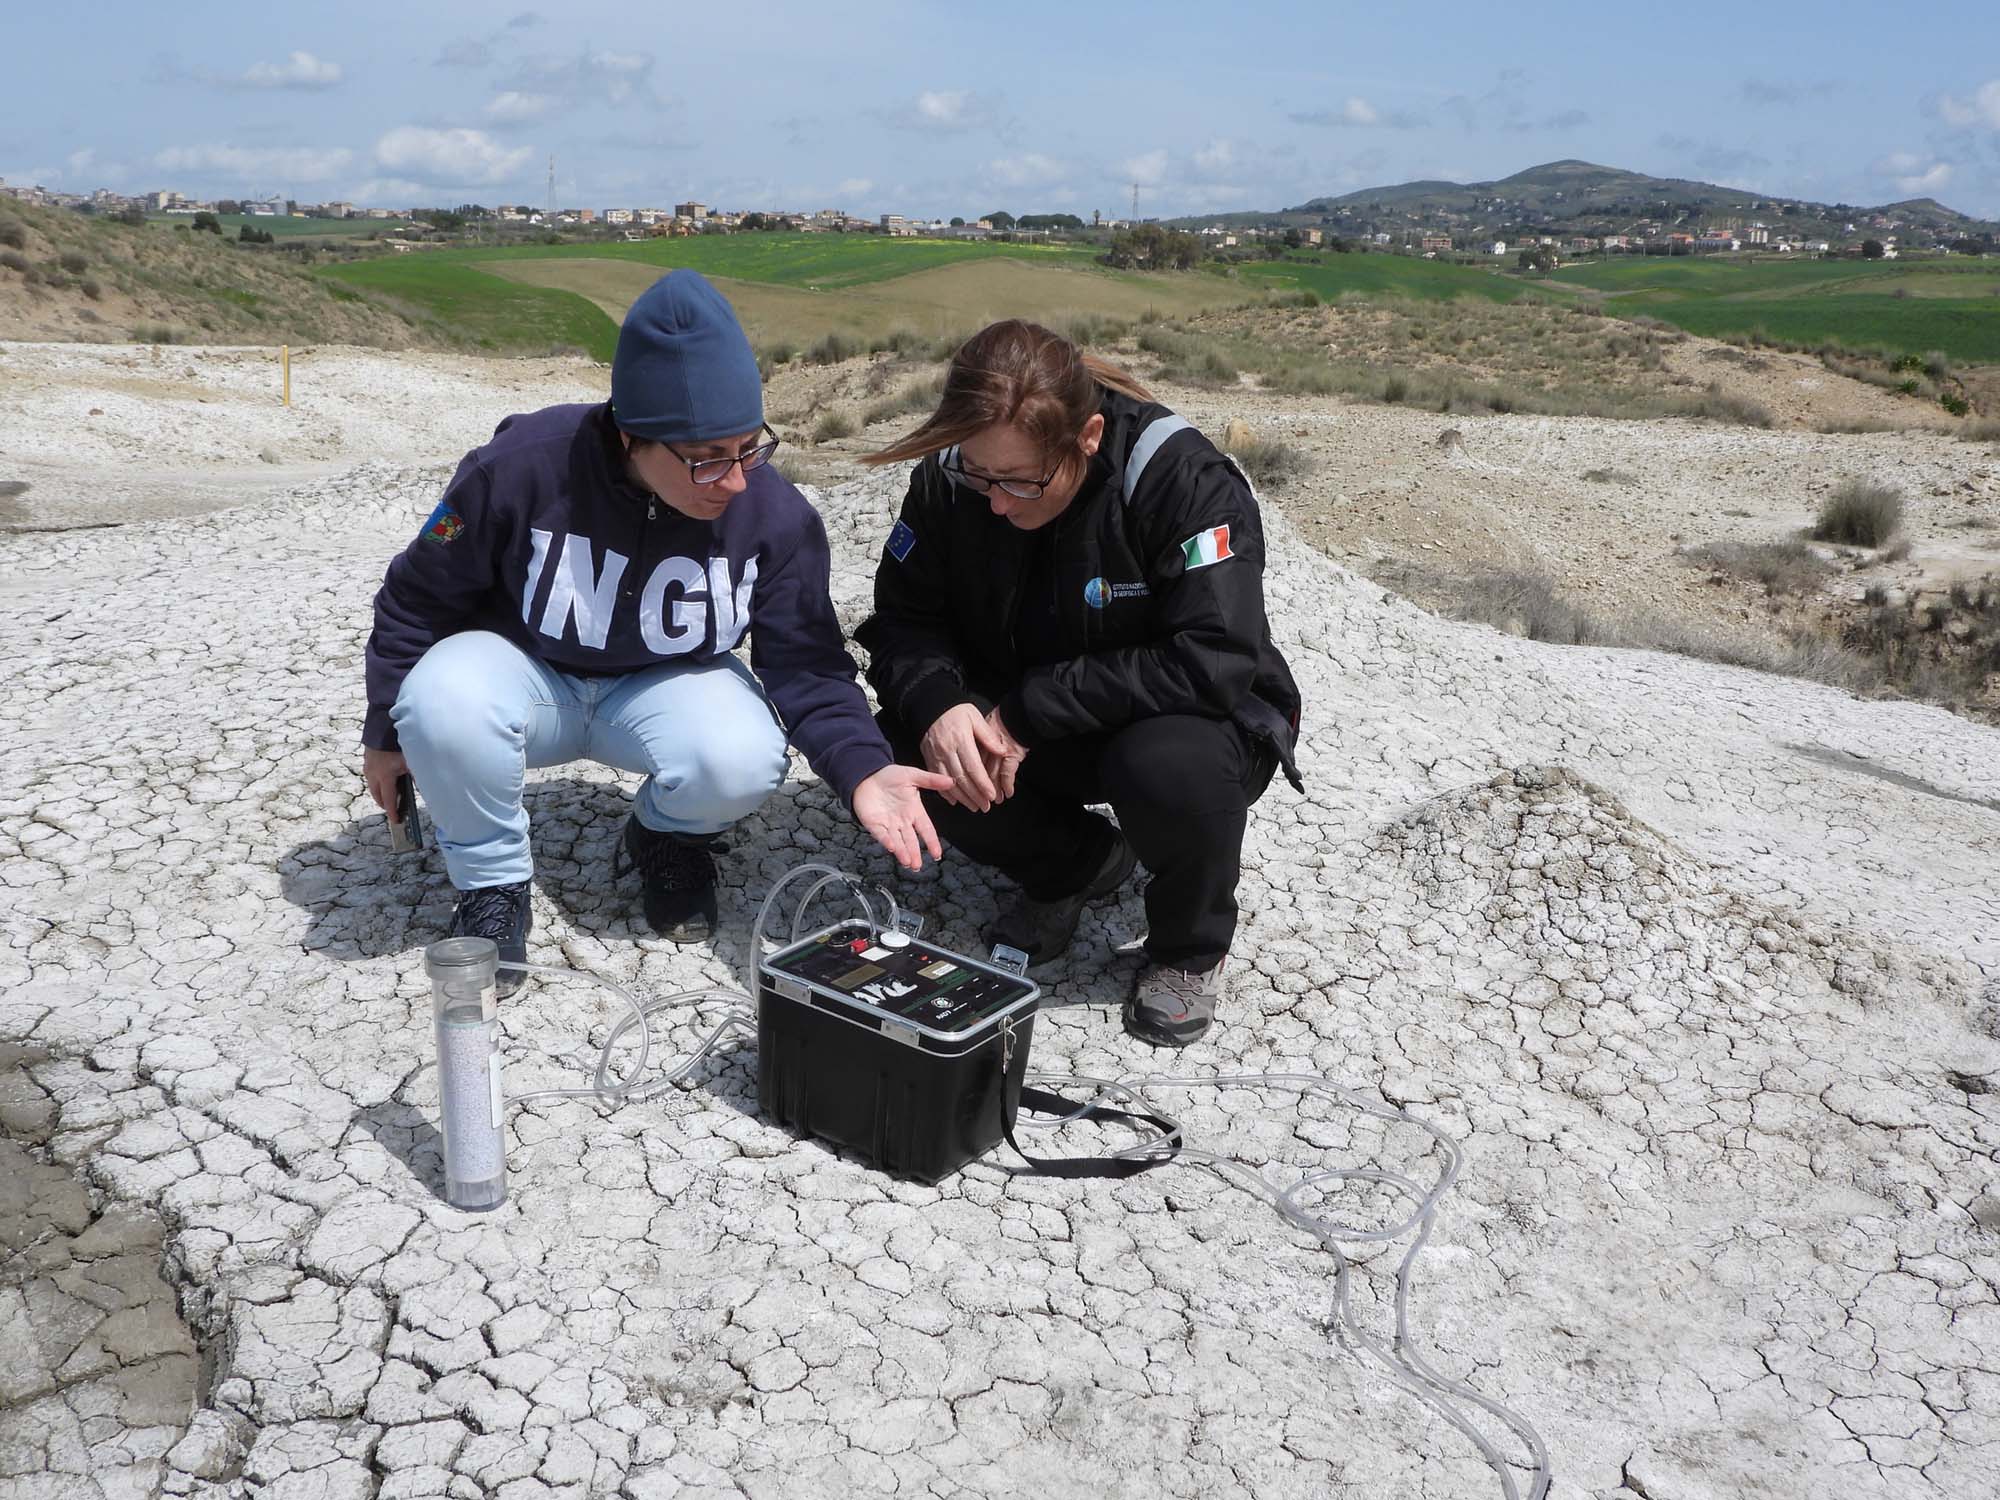 Picture 2. 8 March 2024: Radon measurements close the gas emission vents of Maccalube d’Aragona (Sicily, Italy).
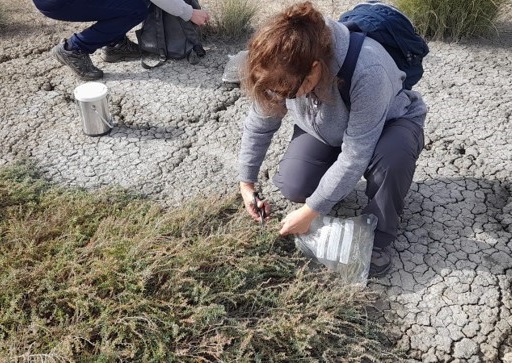
Picture 3. 22 September 2023: Plant species sampling, under the supervision of Natural Reserve staff, at Maccalube d’Aragona (Sicily, Italy) staff.
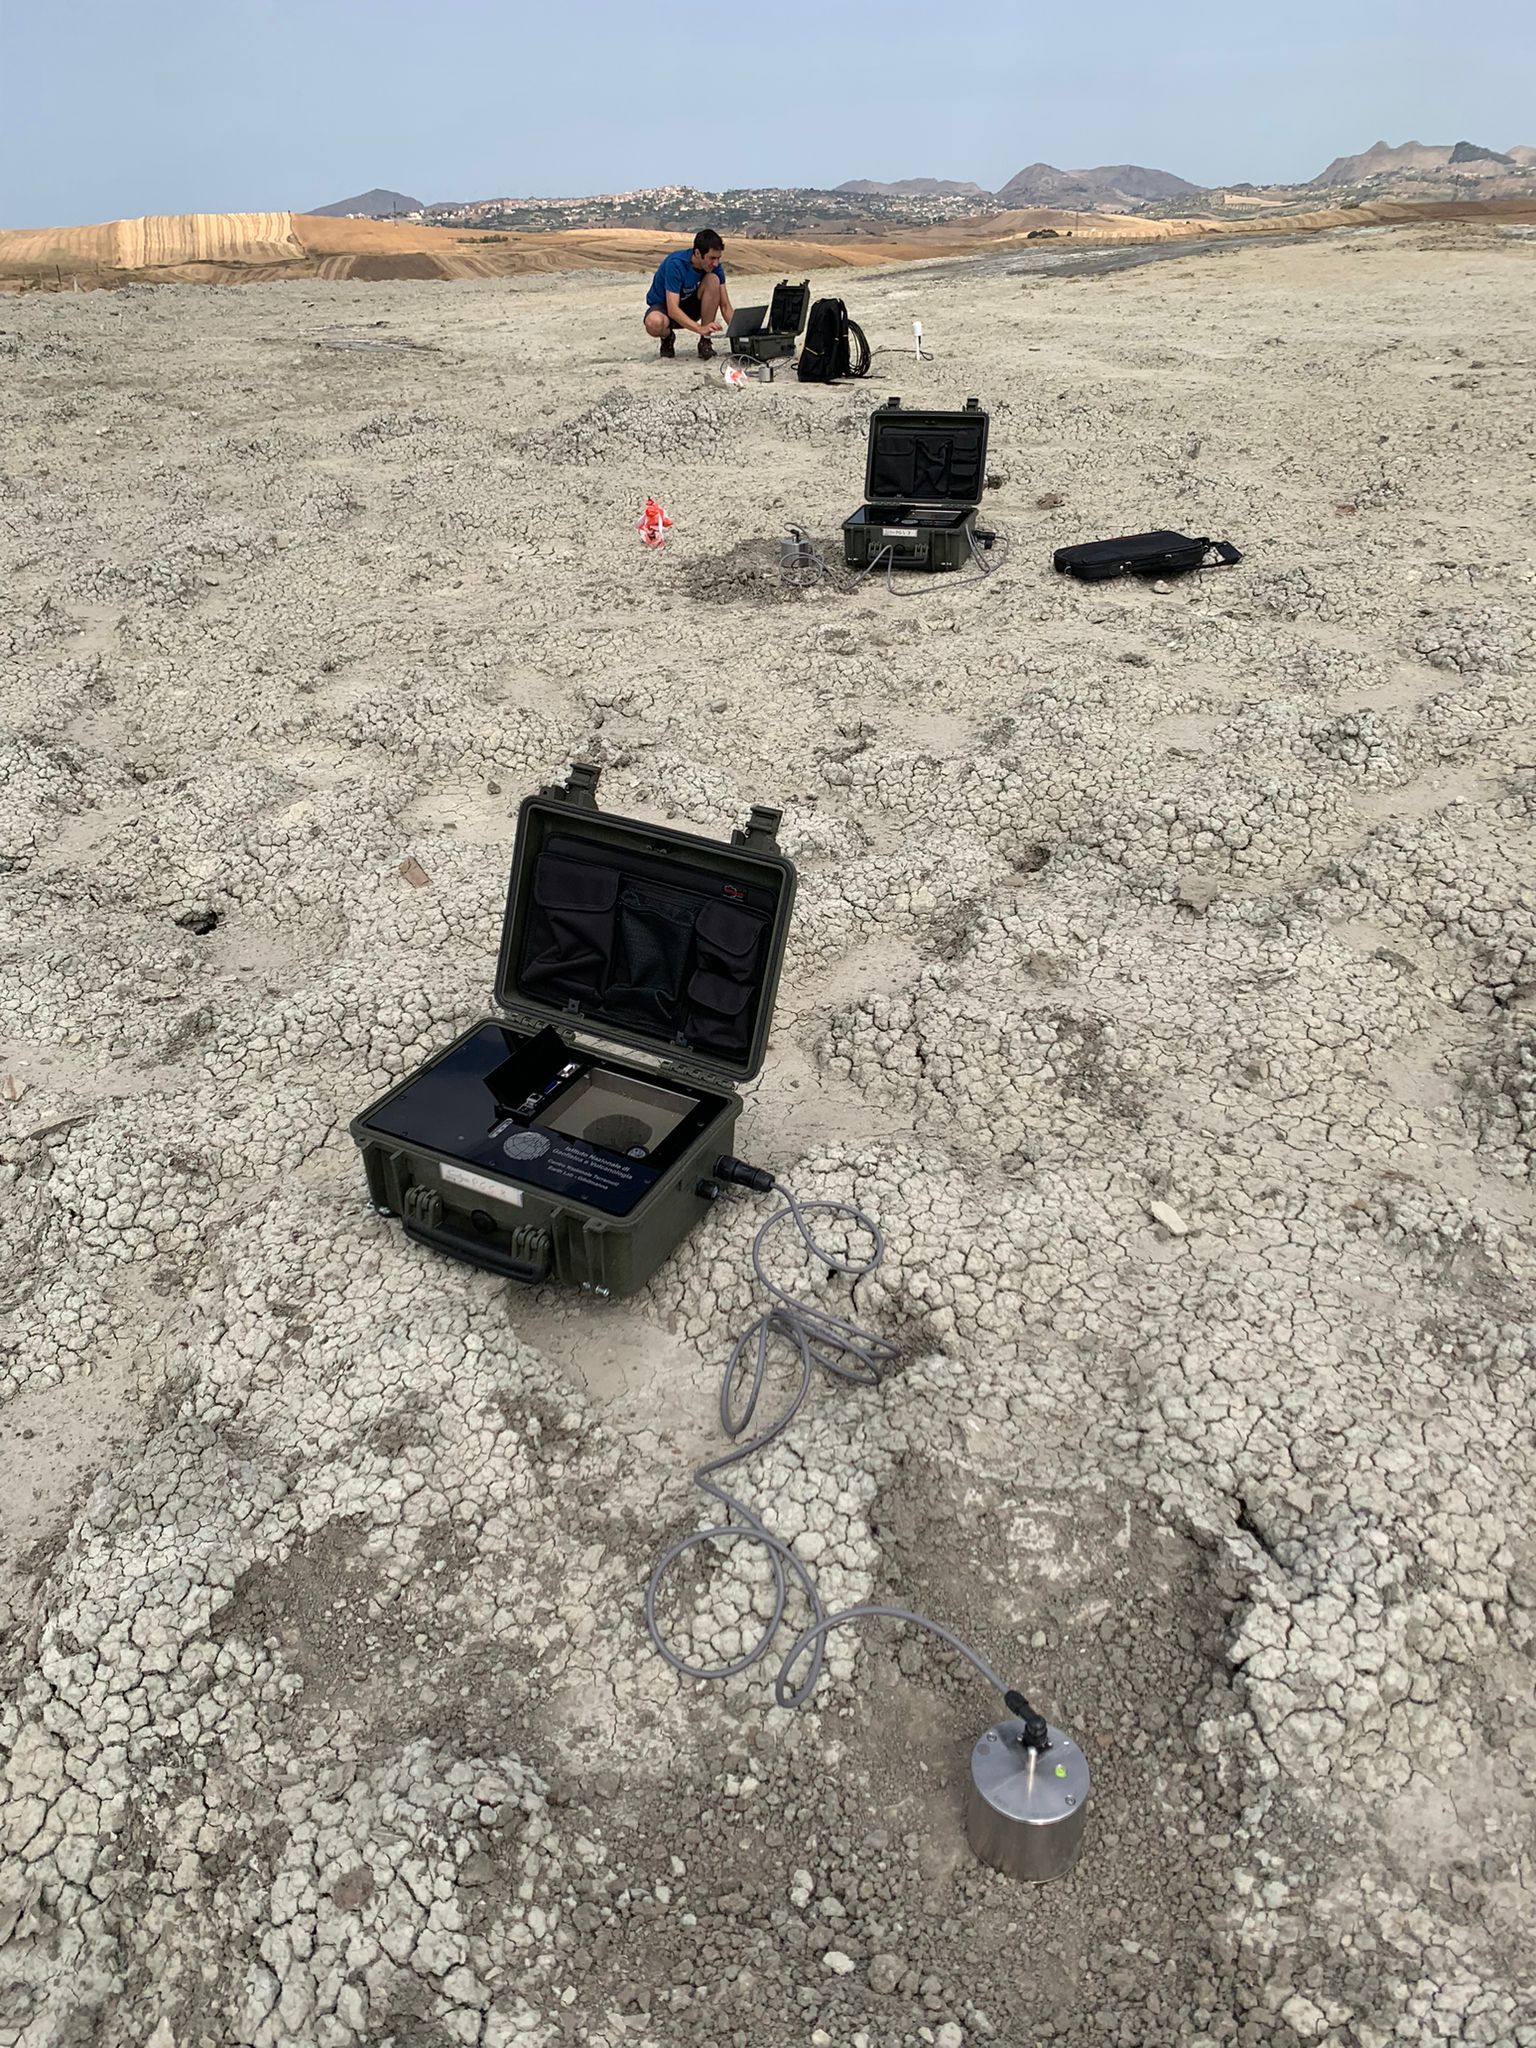
Picture 4. 26 July 2023: Seismic signal acquisition with a linear array in the area of the mud volcanoes of Maccalube d’Aragona (Sicily, Italy).
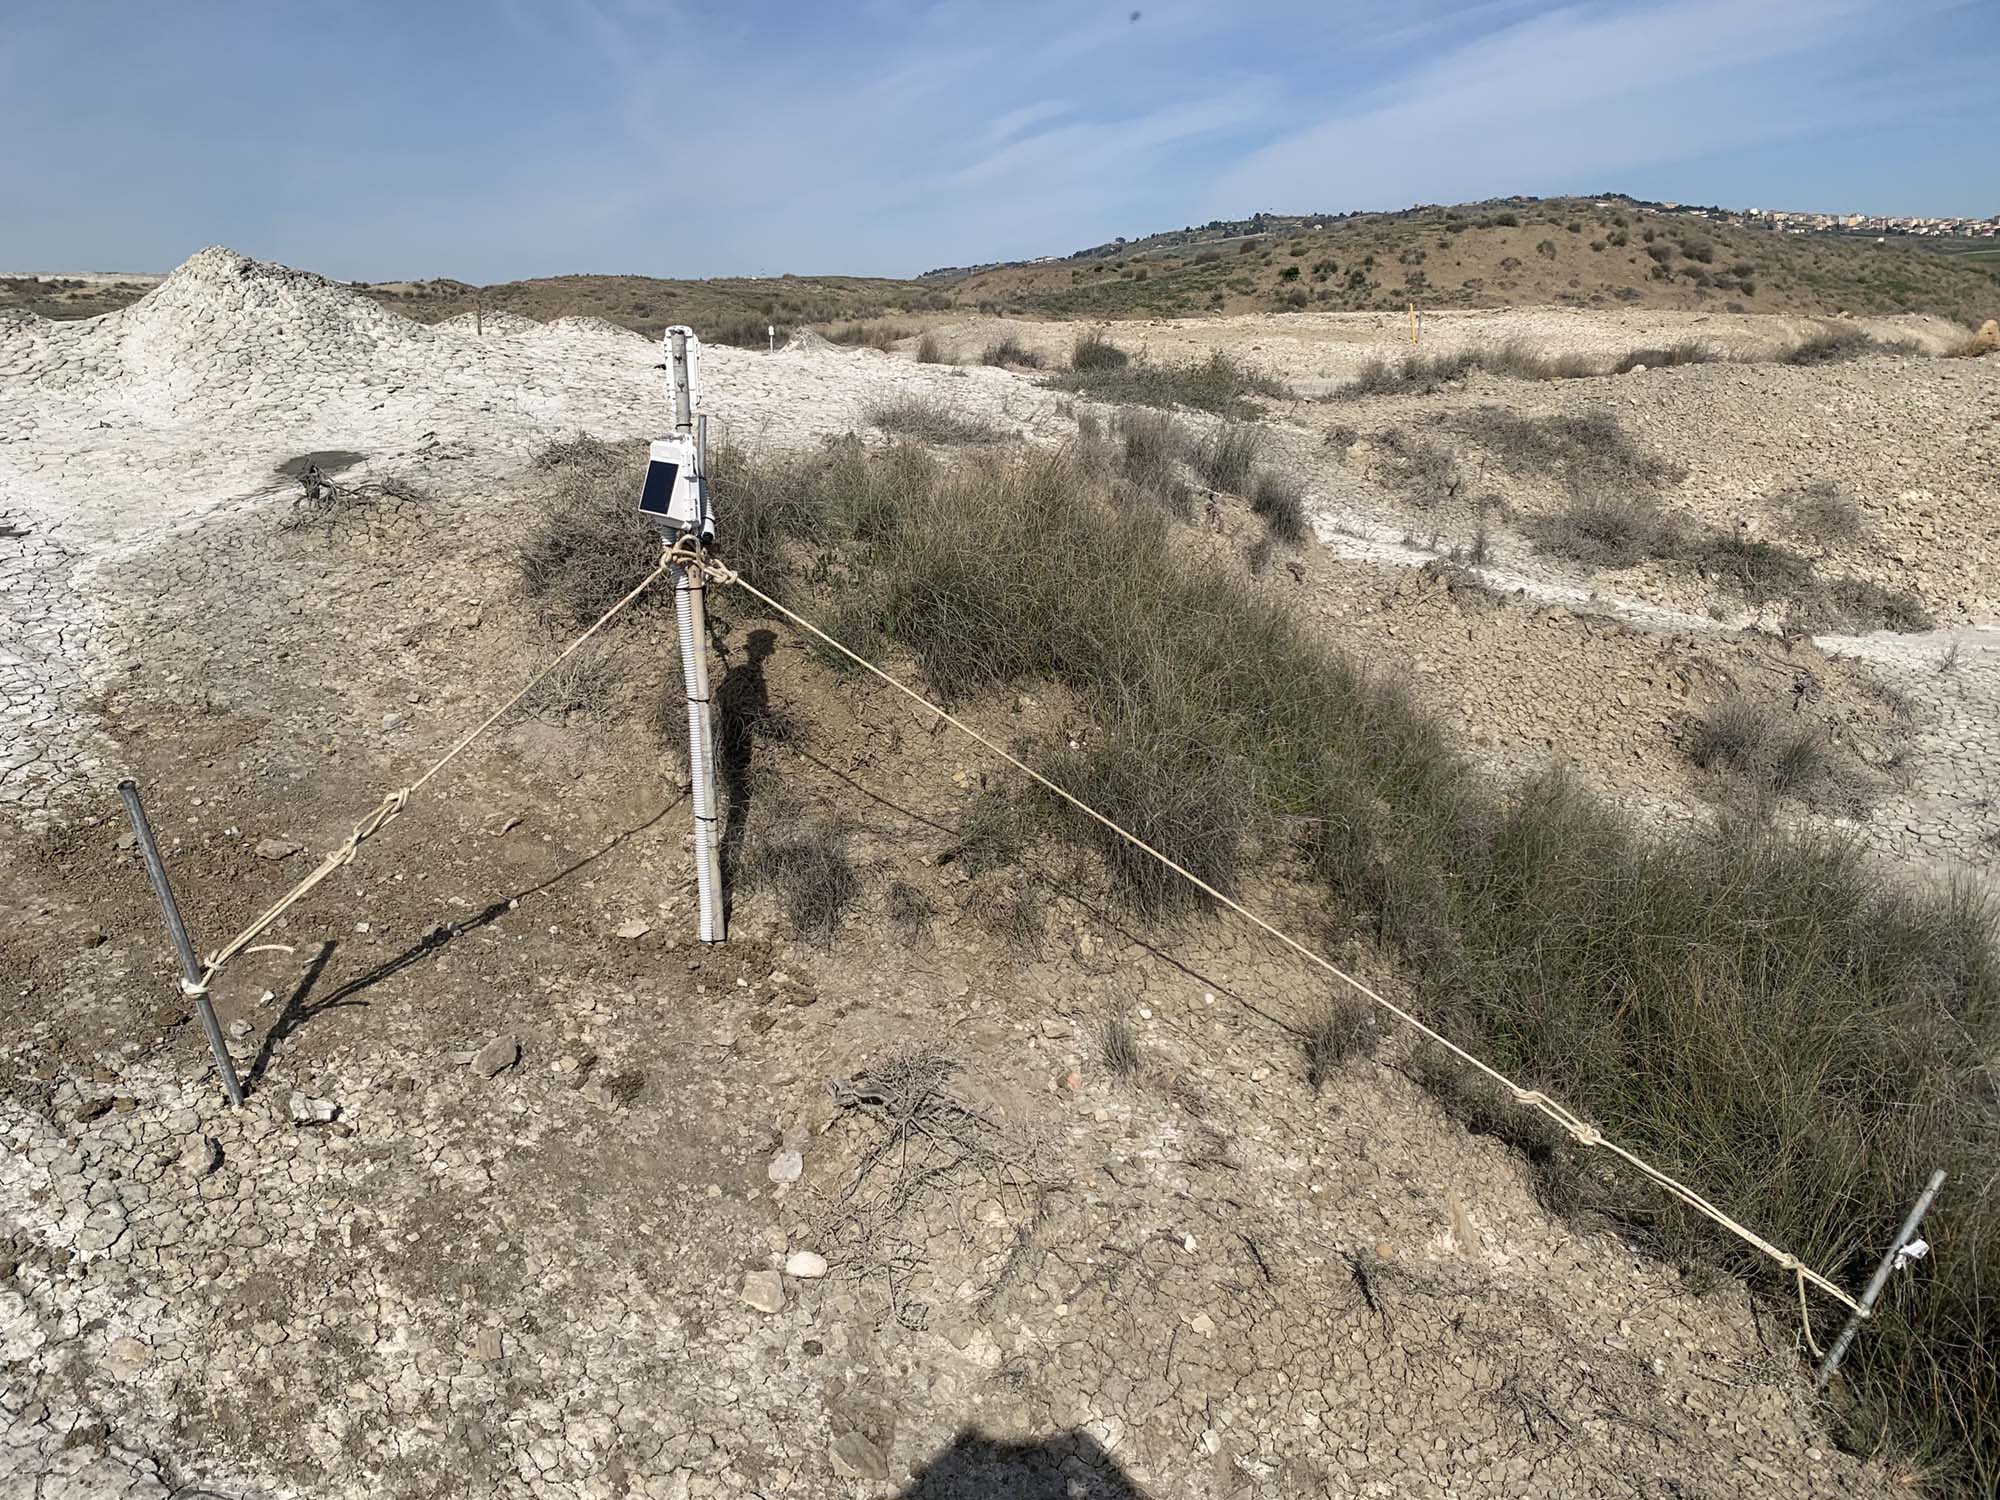
Picture 5. 16 February 2024: Automatic station for collection and transmission of physical soil parameters data, installed at the mud volcanoes of Maccalube d’Aragona (Sicily, Italy).
WP1 - Seismology, Tectonics, Tilt, Hydrology and Vegetation Analysis, for the definition of the relationship between crustal (seismic and aseismic) deformation and geofluid transients
Maccalube d’Aragona
During PROMUD project, seismic and tilt signals acquired at Maccalube d’Aragona (Sicily, Italy) are processed to retrieve the space and time characteristics by using spectrograms, frequency-wavenumber analysis (f-k), polarization and Independent Component Analysis to define the seismo-deformative background state linked to MVs activity state and to monitoring the eventual deviations from this background. The characterization of the mean is carried out by studying the local amplification by applying the H/V spectral ratio (Horizontal-to-Vertical spectral ratio) and using the seismic data recorded by both seismic arrays and tri-directional tromographs.
The interconnections between the MV activities and the regional stress field in the study area are investigated according to the following strategy: a) updating the catalogs of the correlations between the regional earthquakes and the MV activity anomalies and the estimation of the relationship between epicenter-MV distance and earthquakes’ magnitude, by using the Wang method; b) the comparison between seismological parameters and paroxysm occurrence; c) normal stress change estimation for earthquakes occurred inside a volume below the MVs, by using Coulomb method.
The characterization of meteoric components involved in circulation of geofluids is carried out by performing the following measures: a) air temperatures and Rh, atmospheric pressure, wind intensity and rainfall rate to estimate the evaporation/infiltration ratio; hourly measures of soil humidity to estimate the space-temporal changes of surficial permeability; video of gas bubbling are realized to estimate permeability variations. The space-time correlations between geofluid circulation and the results of the metabolomics, proteomic and genomic analysis of the collected vegetation samples are estimated, as well the pattern of radionuclides emissions.
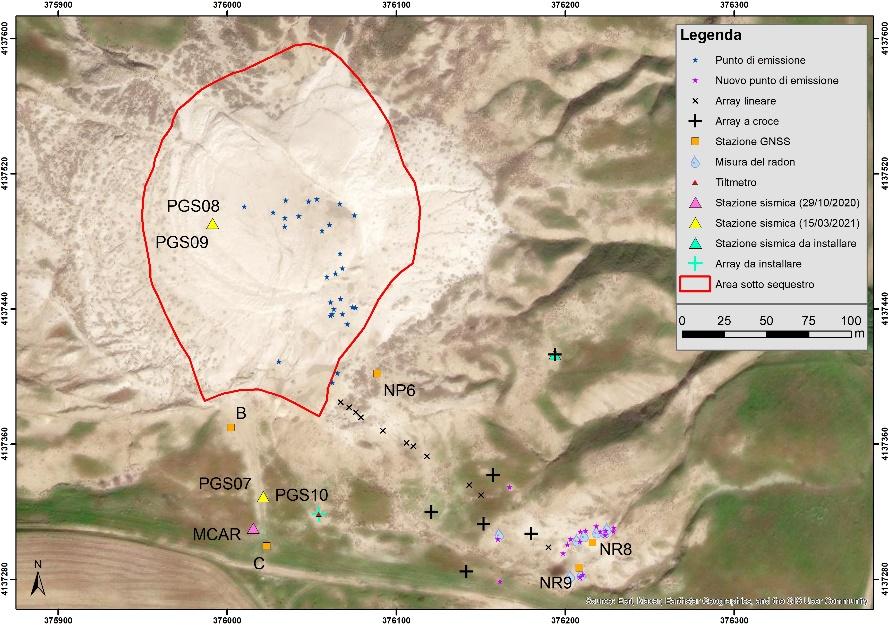
Figure 1. Location of the measurements carried out by WP1 in 2023 at the Riserva Naturale of Maccalube d’Aragona (AG, Sicily, Italy), of the emission vents and of the instrumentation installed in 2024 close to the emissions, according to the legend on the right. This map has been realized with ArcGIS by Eliana Bellucci Sessa (WP1).
Salse di Nirano
The emission system of mud volcanoes inside the Riserva Naturale of the Salse di Nirano (northern Apennine) is investigated by WP1 which identifies the main gas emission conduits by analyzing the local seismicity recordings. The seismic signals are recorded by seismic arrays, are associated with the degassing system and are used to estimate the gas flux emitted in an area. The mean characterization is carried out by estimating the local amplification by using H/V spectral ratio (Horizontal-to-Vertical spectral ratio), using seismic array and tromograph recordings.
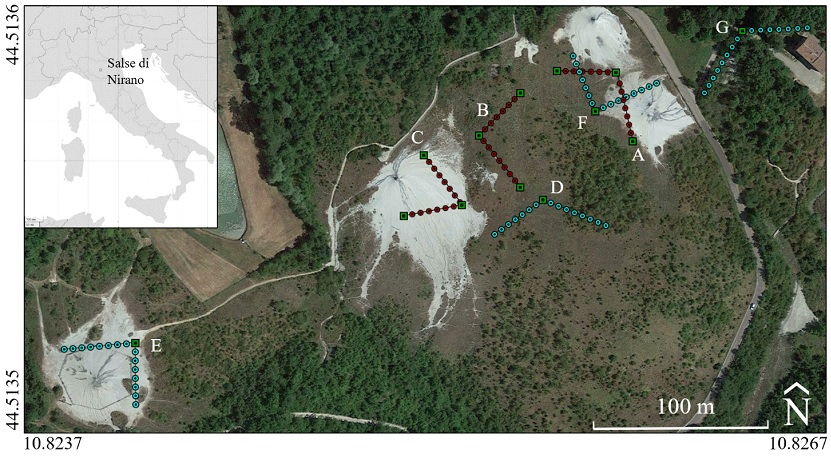
Figure 2. Google Earth satellite image (Immagini Airbus ©2024, Maxar Technologies, Dati Cartografici ©2024) of MVs of Salse di Nirano with the location of the instrumentation used by WP1 to acquire the seismic signal. The cyan and red circles indicate the seismic array stations employed in 2021 (A, B, C) and 2023 (D, E, F, G). The green squares, in correspondence of angular geophones of the array, represent the positions of the tri-component stations. All the others are vertical-component stations.